¡Tu solución está lista!
Nuestra ayuda de expertos desglosó tu problema en una solución confiable y fácil de entender.
Mira la respuestaMira la respuesta done loadingPregunta: Edificios Altos Un arquitecto quiere determinar la relación entre las alturas (en pies) de los edificios y el nimero de pisos en los edificios. Se muestran los datos de ma muestra de 10 edificios en Chicago. Toll Bunt tings An architect wants to dstarmins the relationship between the height (in feet) of buildings and the number of stories in the buildings.
 Hay 4 pasos para resolver este problema.SoluciónPaso 1Mira la respuesta completa
El diagrama de dispersión para los datos proporcionados es:
 Explanation:
Se dibujan los puntos parejas en el plan...
Paso 2 DesbloqueaPaso 3DesbloqueaPaso 4DesbloqueaRespuestaDesbloquea
Texto de la transcripción de la imagen:
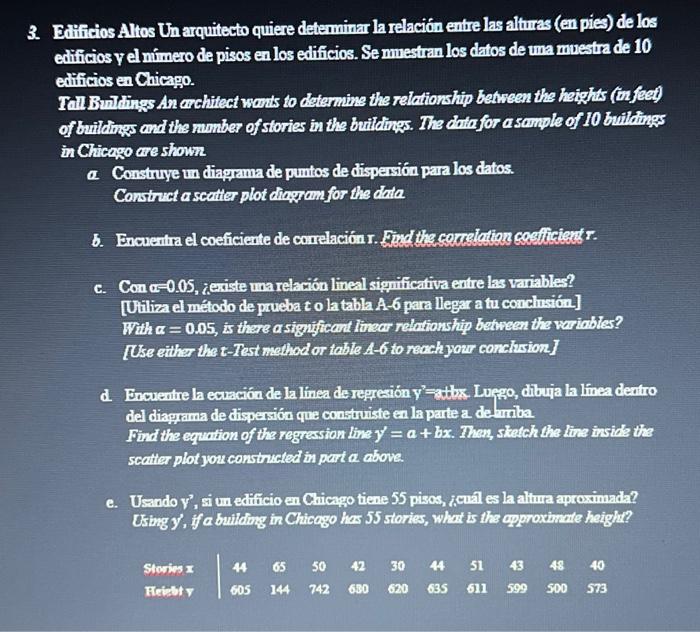
Edificios Altos Un arquitecto quiere determinar la relación entre las alturas (en pies) de los edificios y el nimero de pisos en los edificios. Se muestran los datos de ma muestra de 10 edificios en Chicago. Toll Bunt tings An architect wants to dstarmins the relationship between the height (in feet) of buildings and the number of stories in the buildings. The data for a somple of 10 buildings in Chicago are shown a. Construye un diaqpama de puntos de dispersion para los datos. Construct a scatter plot diagnan for the dada b. Encuentra el coeficiente de comrelacion r. Fidd tha correlation saefficient r. c. Con ∝=0.05, ¿eriste ma relarión lineal signiificativa entre las variables? [Utiliza el método de prueba t o la tabla A 6 para llegar a tu conclusión] ] With α=0.05, is there a signifficant linear relarionship between the varriables? [Use either the 2 -Test method or table A-6 to reach your conchision] d. Encuentre a ecuación de la linea de represión y y =atbx. Luggo, dibuja la linea deatro del diagrama de dispensión que construiste en la parte a de Umiba. Find the equation of the regrassion line y′=a+bx. Then, sketch the line inside the scatter plot you constncted in part a above. e. Usando y2, si un edificio en Chicago tiene 55 pisos, icua1 es la altma aproximada? Using y,' if a building in Chicago has 55 stories, what is the cqpproximate height? \begin{tabular}{l|cccccccccc} Storins & 44 & 65 & 50 & 42 & 30 & 44 & 51 & 43 & 48 & 40 \\ Heisut y & 605 & 144 & 742 & 630 & 620 & 635 & 611 & 599 & 500 & 573 \end{tabular}

Estudia mejor, ¡ahora en español!
Entiende todos los problemas con explicaciones al instante y pasos fáciles de aprender de la mano de expertos reales.