¡Tu solución está lista!
Nuestra ayuda de expertos desglosó tu problema en una solución confiable y fácil de entender.
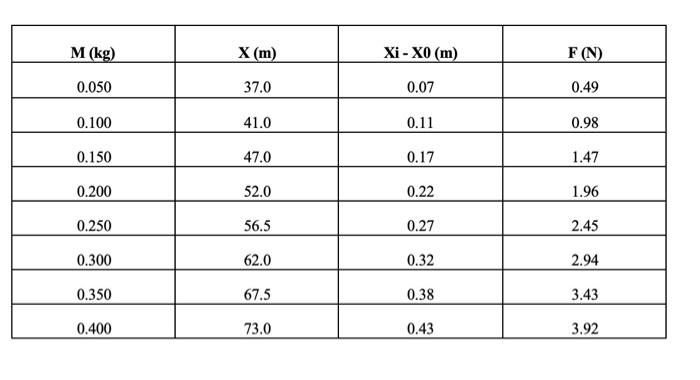
Mira la respuestaMira la respuesta done loadingPregunta: \begin{tabular}{|c|c|c|c|} \hline M(kg) & X(m) & Xi−X0(m) & F(N) \\ \hline 0.050 & 37.0 & 0.07 & 0.49 \\ \hline 0.100 & 41.0 & 0.11 & 0.98 \\ \hline 0.150 & 47.0 & 0.17 & 1.47 \\ \hline 0.200 & 52.0 & 0.22 & 1.96 \\ \hline 0.250 & 56.5 & 0.27 & 2.45 \\ \hline 0.300 & 62.0 & 0.32 & 2.94 \\ \hline 0.350 & 67.5 & 0.38 & 3.43 \\ \hline 0.400 & 73.0 & 0.43 & 3.92
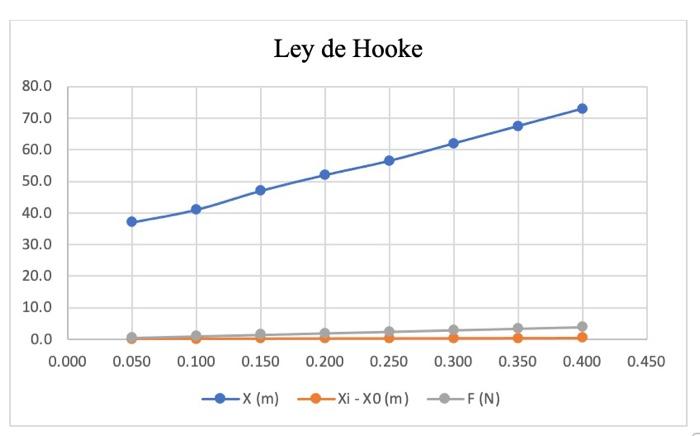
Urgente!!Encuentra la pendiente.Describa el comportamiento de la grafica.
Urgent! Find the slope and describe the behavior of the graph. Thank you. Hay 2 pasos para resolver este problema.Solución100% (1 calificación)Paso 1Mira la respuesta completa
The given graph is plotted between the force applied and the elongation.
The force is measured in Ne...
Paso 2 DesbloqueaRespuestaDesbloquea
Texto de la transcripción de la imagen:
\begin{tabular}{|c|c|c|c|} \hline M(kg) & X(m) & Xi−X0(m) & F(N) \\ \hline 0.050 & 37.0 & 0.07 & 0.49 \\ \hline 0.100 & 41.0 & 0.11 & 0.98 \\ \hline 0.150 & 47.0 & 0.17 & 1.47 \\ \hline 0.200 & 52.0 & 0.22 & 1.96 \\ \hline 0.250 & 56.5 & 0.27 & 2.45 \\ \hline 0.300 & 62.0 & 0.32 & 2.94 \\ \hline 0.350 & 67.5 & 0.38 & 3.43 \\ \hline 0.400 & 73.0 & 0.43 & 3.92 \\ \hline \end{tabular}
Ley de Hooke

Estudia mejor, ¡ahora en español!
Entiende todos los problemas con explicaciones al instante y pasos fáciles de aprender de la mano de expertos reales.