¡Tu solución está lista!
Nuestra ayuda de expertos desglosó tu problema en una solución confiable y fácil de entender.
Mira la respuestaMira la respuesta done loadingPregunta: Sugar in the cereal. Different cereals were randomly selected and the sugar content was obtained with the following results for cheerios, harmony, Smart start, Cocoa puffs, lucky charms, Cornflakes, Fruit Loops, Wheaties,
Sugar in the cereal. Different cereals were randomly selected and the sugar content was obtained with the following results for cheerios, harmony, Smart start, Cocoa puffs, lucky charms, Cornflakes, Fruit Loops, Wheaties, Captain Crunch, etc. Use a 0.05 significance level to test a lobbyist's claim that the mean of all cereals is less than 0.4 grams.


The decision is:

The conclusion is:

The alternative hypothesis is:

The null hypothesis is:

The value of p is:

The test statistic is:

The conclusion is:
Alternatives are:
 Hay 4 pasos para resolver este problema.SoluciónPaso 1Mira la respuesta completa
Given data is shown below ;
0.54 , 0.57 , 0.16 , 0.31 , 0.39 , 0.41 , 0.51 , 0.41 , 0.36 , 0.22 , 0....
Paso 2 DesbloqueaPaso 3DesbloqueaPaso 4DesbloqueaRespuestaDesbloquea
Texto de la transcripción de la imagen:
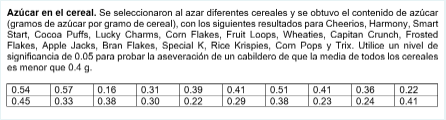
Azúcar en el cereal. Se seleccionaron al azar diferentes cereales y se obtuvo el contenido de azúcar (gramos de azúcar por gramo de cereal), con los siguientes resultados para Cheerios, Harmony, Smart Start, Cocoa Puffs, Lucky Charms, Corn Flakes, Fruit Loops, Wheaties, Capitan Crunch, Frosted Flakes, Apple Jacks, Bran Flakes, Special K, Rice Krispies, Com Pops y Trix. Utilice un nivel de significancia de 0.05 para probar la aseveración de un cabildero de que la media de todos los cereales es menor que 0.49 0.54 0.57 0.16 0.31 0.39 0.41 0.51 0.41 0.36 0.22 0.45 0.33 0.38 0.30 0.22 0.29 0.38 0.23 0.24 0.41
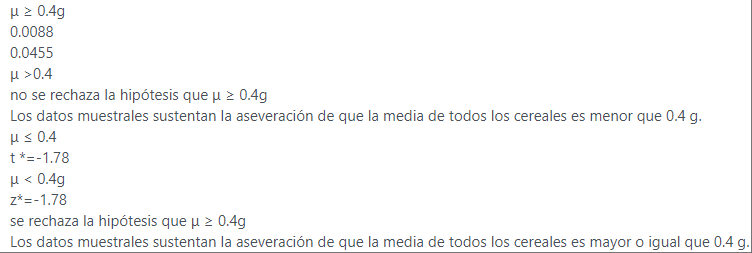
u > 0.49 0.0088 0.0455 u >0.4 no se rechaza la hipótesis que u 20.45 Los datos muestrales sustentan la aseveración de que la media de todos los cereales es menor que 0.4 g. μs 0.4 t*=-1.78 < 0.49 z*=-1.78 se rechaza la hipótesis que u 20.49 Los datos muestrales sustentan la aseveración de que la media de todos los cereales es mayor o igual que 0.4 g.

Estudia mejor, ¡ahora en español!
Entiende todos los problemas con explicaciones al instante y pasos fáciles de aprender de la mano de expertos reales.