¡Tu solución está lista!
Nuestra ayuda de expertos desglosó tu problema en una solución confiable y fácil de entender.
Mira la respuestaMira la respuesta done loadingPregunta: In a study of the gas mileage per gallon of a car brand, the mean was found to be 27.5 and the median 26.8. The smallest value in the study was 12.7 miles per gallon and the largest was 50.2. The first and third quartiles were 17.95 and 35.45 miles per gallon, respectively.a. Construct a box plot to represent these data.b. Make a comment about the
In a study of the gas mileage per gallon of a car brand, the mean was found to be 27.5 and the median 26.8. The smallest value in the study was 12.7 miles per gallon and the largest was 50.2. The first and third quartiles were 17.95 and 35.45 miles per gallon, respectively.a. Construct a box plot to represent these data.b. Make a comment about the distribution asymmetry.c. Identify the quartiles and the median. Esta es la mejor manera de resolver el problema.Solución
a. b. The given distribution is asymmetrical. We can see from the box plot that the distribution is not symmetrical. The box plot (attached)…
Mira la respuesta completa
Texto de la transcripción de la imagen:
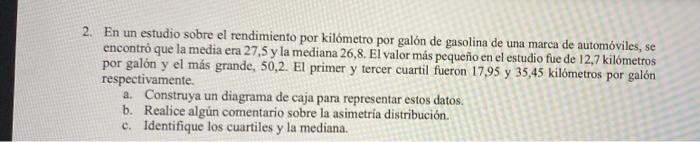
2. En un estudio sobre el rendimiento por kilómetro por galón de gasolina de una marca de automóviles, se encontró que la media era 27,5 y la mediana 26,8. El valor más pequeño en el estudio fue de 12,7 kilómetros por galón y el más grande, 50,2. El primer y tercer cuartil fueron 17,95 y 35,45 kilómetros por galón respectivamente. a. Construya un diagrama de caja para representar estos datos. b. Realice algún comentario sobre la asimetría distribución. c. Identifique los cuartiles y la mediana.

Estudia mejor, ¡ahora en español!
Entiende todos los problemas con explicaciones al instante y pasos fáciles de aprender de la mano de expertos reales.