¡Tu solución está lista!
Nuestra ayuda de expertos desglosó tu problema en una solución confiable y fácil de entender.
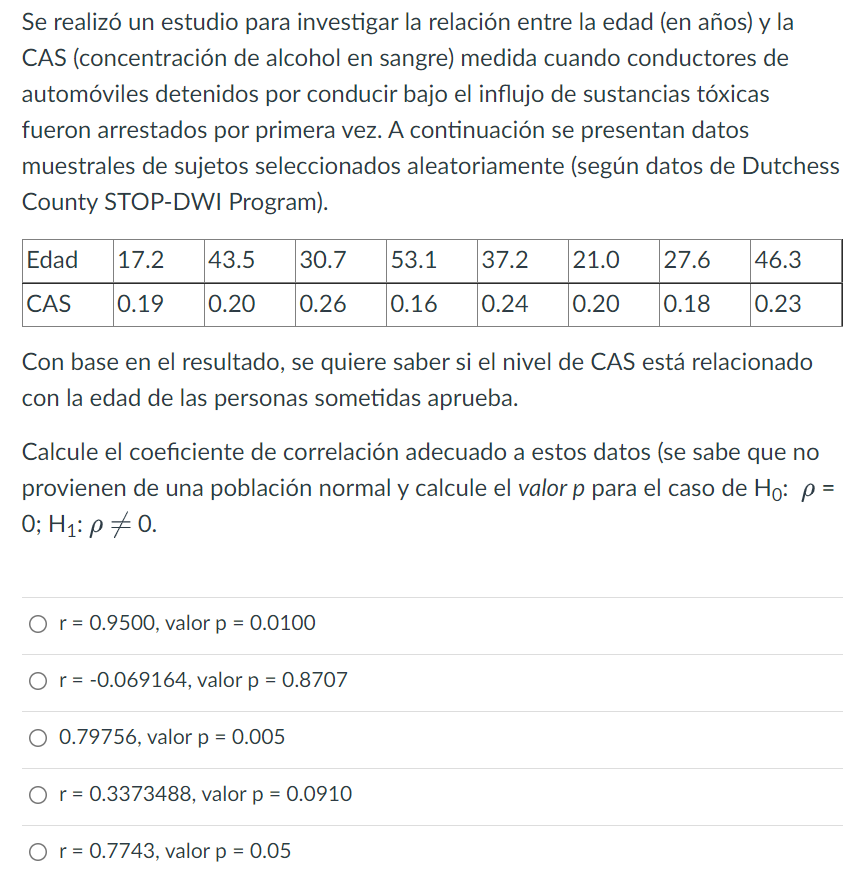
Mira la respuestaMira la respuesta done loadingPregunta: A study was conducted to investigate the relationship between age (in years) and CAS (blood alcohol concentration) measured when car drivers stopped for driving under the influence of toxic substances were first arrested. Below are sample data from randomly selected subjects (based on data from the Dutchess County STOP-DWI Program).
A study was conducted to investigate the relationship between age (in years) and CAS (blood alcohol concentration) measured when car drivers stopped for driving under the influence of toxic substances were first arrested. Below are sample data from randomly selected subjects (based on data from the Dutchess County STOP-DWI Program).
Edad 17.2 43.5 30.7 53.1 37.2 21.0 27.6 46.3 CAS 0.19 0.20 0.26 0.16 0.24 0.20 0.18 0.23 Based on the result, we want to know if the level of CAS is related to the age of the people submitted approved.
Calculate the correlation coefficient appropriate to these data (they are known not to come from a normal population and calculate the p-value for the case of H0:p = 0; H1:p= 0.
The options for the answers are below.
 Queda solo un paso para resolver este problema.SoluciónPaso 1Mira la respuesta completa
Hypotheses are:
Let us first find sample correlation coefficient (r):
Total
X
17.2
43.5
30.7
53.1
37.2
21.0
27.6
46.3
276.6
Y
0.19
0.20
0.26
0.16
0.24
0.20
0.18
0.23
1.66
X^2
295.84
1892.25
942.49
2819.61
1383.84
441.00
761.76
2143.69
10680.48
Y^2
0.0361
0.0400
0.0676
0.0256
0.0576
0.0400
0.0324
0.0529
0.3522
XY
3.268
8.700
7.982
8.496
8.928
4.200
4.968
10.649
57.191
Sample correaltion coefficient i...
Respuesta Desbloquea

Estudia mejor, ¡ahora en español!
Entiende todos los problemas con explicaciones al instante y pasos fáciles de aprender de la mano de expertos reales.