¡Tu solución está lista!
Nuestra ayuda de expertos desglosó tu problema en una solución confiable y fácil de entender.
Mira la respuestaMira la respuesta done loadingPregunta: With the results of the AG° Graph in depending on the
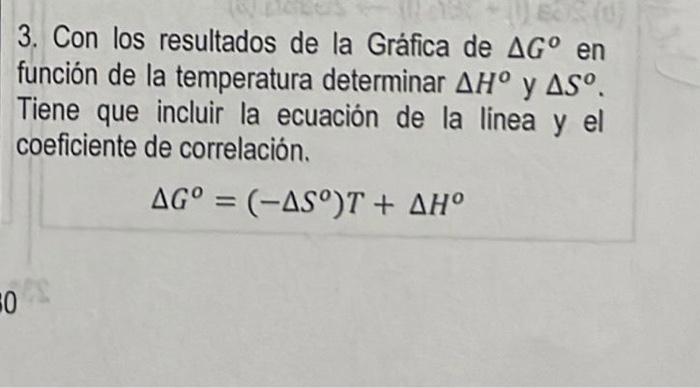
With the results of the AG° Graph in depending on the temperature, determine AH° and AS°. You have to include the equation of the line and the correlation coefficient.
AG°=(-AS°)T + AH°
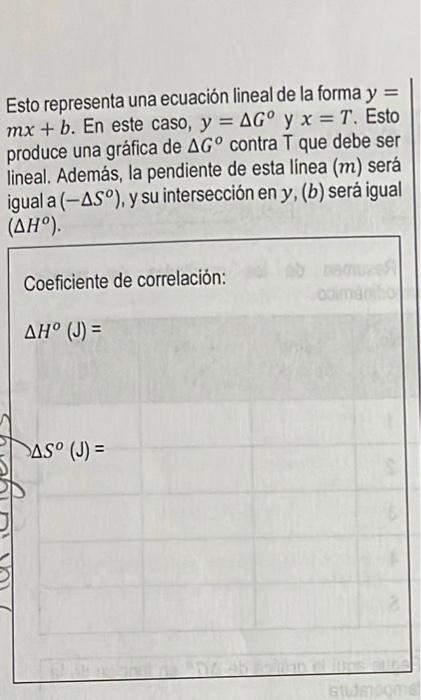
This represents a linear equation of the form and mx + b. In this case, y = AG° and x = T. This produces a plot of AG° against T which must be
linear. Also, the slope of this line (m) will be equal to (-AS°), and its y-intercept, (b) will be equal (AH°). This represents a linear equation of the form and mx + b. In this case, y = AG° and x = T. This produces a plot of AG° against T which must be
linear. Also, the slope of this line (m) will be equal to (-AS°), and its y-intercept, (b) will be equal (AH°).
Correlation coefficient:
AH° (J) =
DAS° (J) =
 Esta es la mejor manera de resolver el problema.Solución


Estudia mejor, ¡ahora en español!
Entiende todos los problemas con explicaciones al instante y pasos fáciles de aprender de la mano de expertos reales.