¡Tu solución está lista!
Nuestra ayuda de expertos desglosó tu problema en una solución confiable y fácil de entender.
Mira la respuestaMira la respuesta done loadingPregunta: Question: As part of a study on psychology and education to optimize teaching curricula that integrate innovative perspectives, a group of school psychologists together with the school organization want to examine whether students in the Art curriculum maintain their school achievement over time. For this they took a group of 20 students and annually
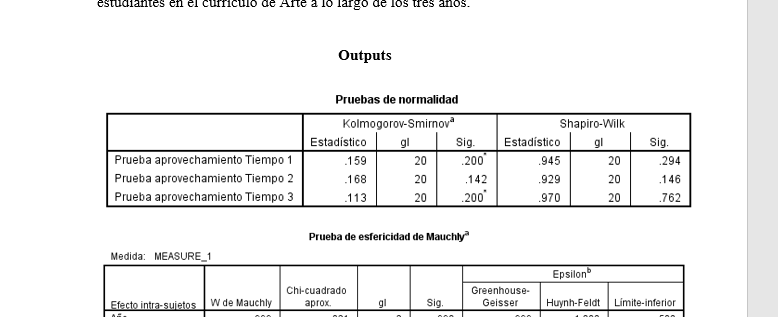
Question: As part of a study on psychology and education to optimize teaching curricula that integrate innovative perspectives, a group of school psychologists together with the school organization want to examine whether students in the Art curriculum maintain their school achievement over time. For this they took a group of 20 students and annually administered a test of academic achievement at the end of the school year. Measures were taken from the last 3 years. We want to examine whether there are differences in the scores of the academic achievement tests of the group of 20 students in the Art curriculum over the three years.
Answer the following questions:
1. Possible research question:
2. Develop the hypotheses:
H0 =
H1 =
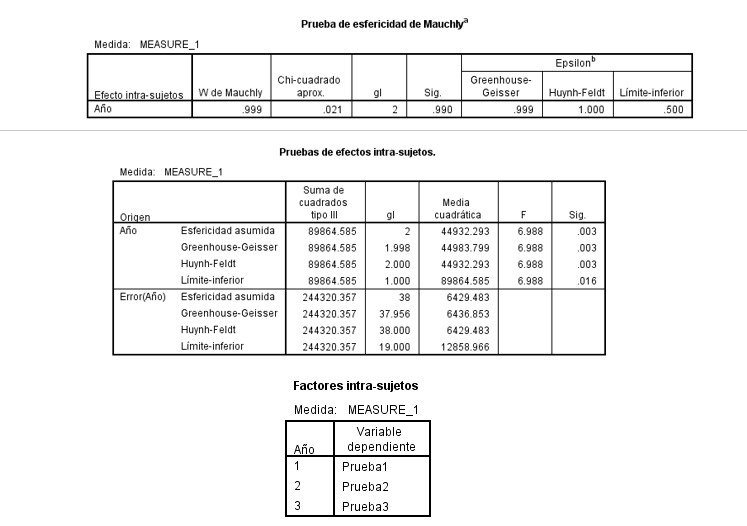
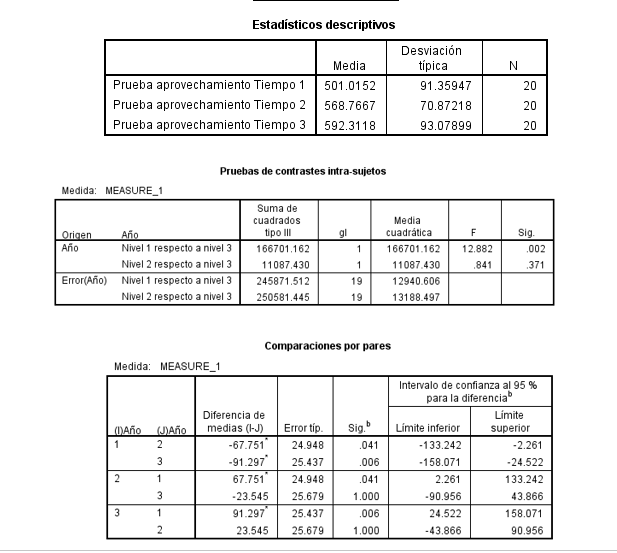
3. Statistical analysis:
4. Conclusion:
5. Report and interpret results appropriately in APA style.
 Esta es la mejor manera de resolver el problema.Solución
Solution: (1) Possible Research Question: Whether Art Curriculum has any impact on student performance over time? (2) Hypothesis Testing: Ho: Ha: Atleast one of…
Mira la respuesta completa

Estudia mejor, ¡ahora en español!
Entiende todos los problemas con explicaciones al instante y pasos fáciles de aprender de la mano de expertos reales.