Pregunta: QUESTION 4 Consider the formulation on Excel of a transportation problem as shown below. The diagram shows a layout of the arrangement of the important variables in spreadsheet format. Considere la formulación en Excel del problema de transportación que se muestra abajo. El diagrama muestra el arreglo de espacio de las variables importantes en formato de
 Esta pregunta aún no se resolvió!¿No es lo que buscas?Envía tu pregunta a un experto en la materia.Texto de la transcripción de la imagen:QUESTION 4 Consider the formulation on Excel of a transportation problem as shown below. The diagram shows a layout of the arrangement of the important variables in spreadsheet format. Considere la formulación en Excel del problema de transportación que se muestra abajo. El diagrama muestra el arreglo de espacio de las variables importantes en formato de hoja de cálculo de Excel Answer the following questions in regard to this layout. Conteste la siguiente pregunta sobre este espaciamiento. G 1 2 his 3 Transported Units DC1 D2 Daily Production DC3 Demand Satisfied Demand Required S 15 250 6 7 8 Plant 1 Plant 2 21 28 25 13 19 200 200 250 0 Bally demand 200 200 250 Units transported 22 6 0 o a Plant 2 Total Transportation Costs $0 16 17 18 In what cells are the decision variables displayed? En que celdas se muestran las variables de decisión? Click Save and Submit to save and submit. Click Save All Answers to save all answers. In what cells are the decision variables displayed? En que celdas se muestran las variables de decisión? O a. From C12 to E13. (De C12 a E13.) O b. At G15. (En G15.) O c. From C6 to E7. (De C6 a E13.) O d. From C9 to E9. (De C9 a E9.)
Texto de la transcripción de la imagen:
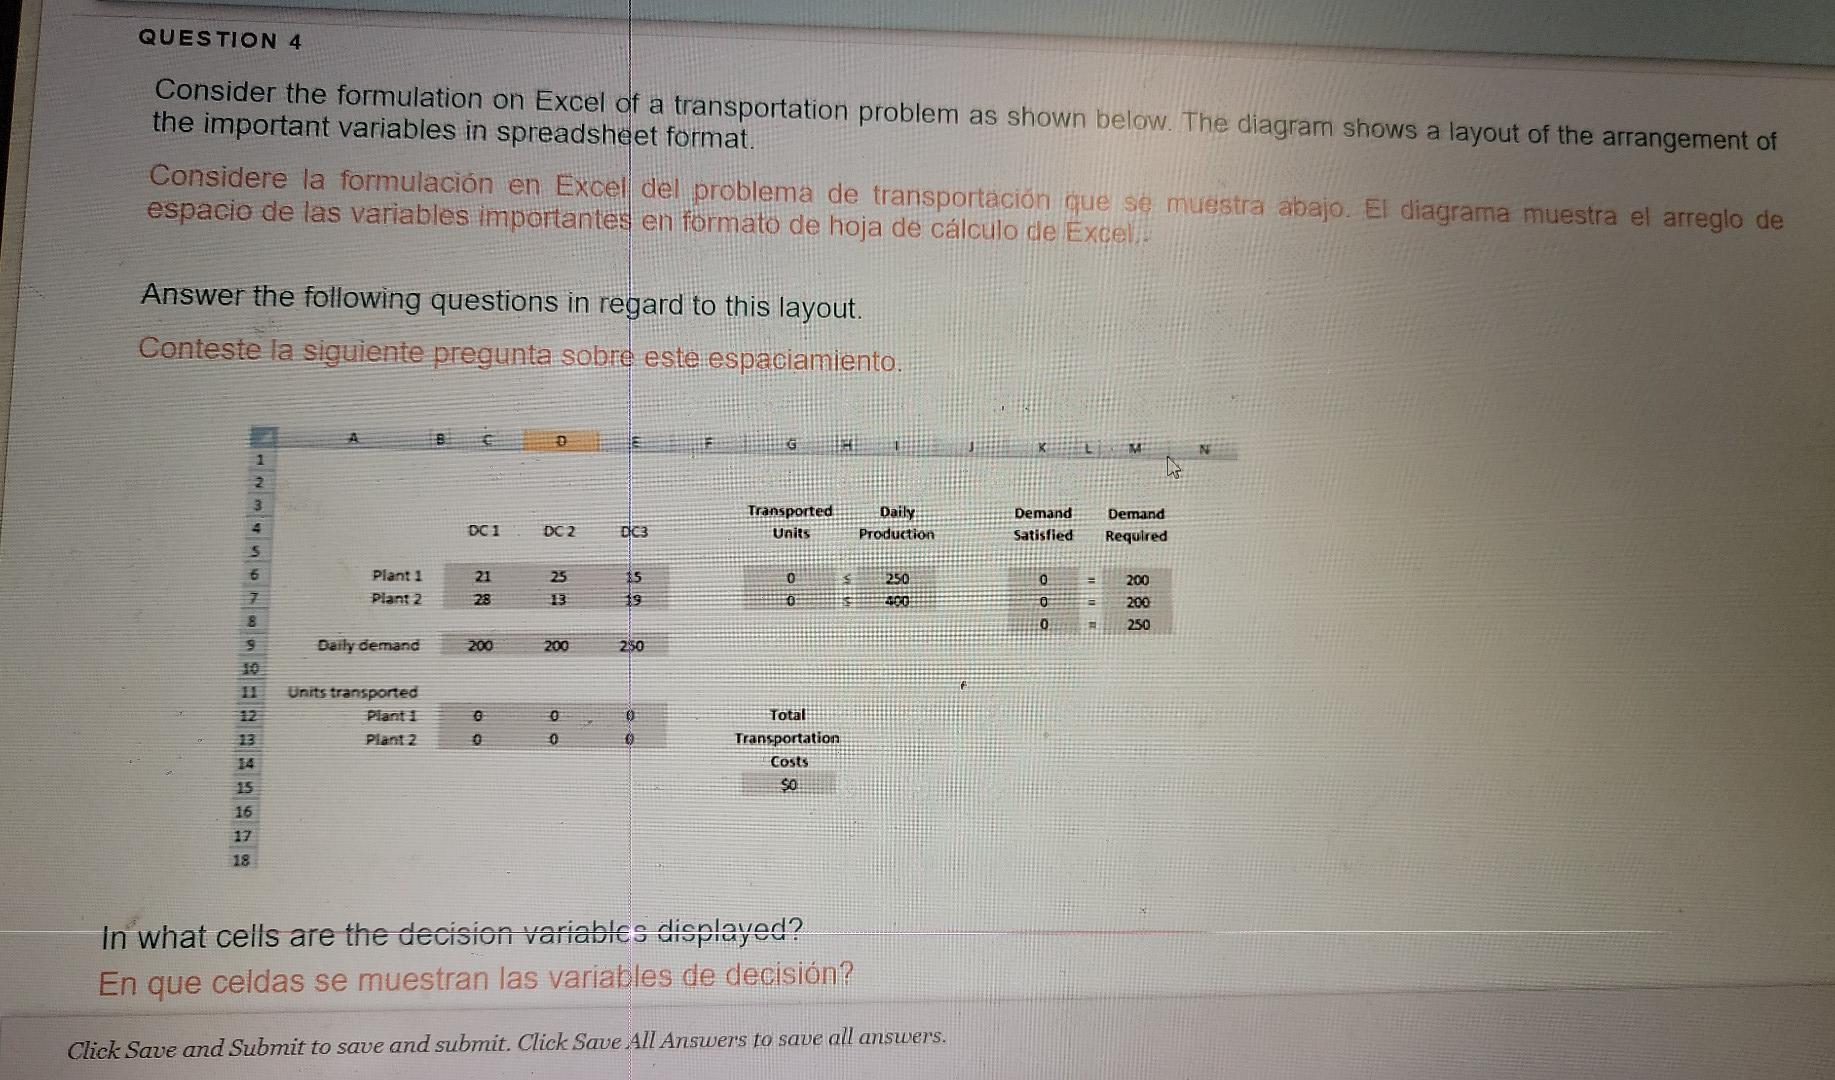
QUESTION 4 Consider the formulation on Excel of a transportation problem as shown below. The diagram shows a layout of the arrangement of the important variables in spreadsheet format. Considere la formulación en Excel del problema de transportación que se muestra abajo. El diagrama muestra el arreglo de espacio de las variables importantes en formato de hoja de cálculo de Excel Answer the following questions in regard to this layout. Conteste la siguiente pregunta sobre este espaciamiento. G 1 2 his 3 Transported Units DC1 D2 Daily Production DC3 Demand Satisfied Demand Required S 15 250 6 7 8 Plant 1 Plant 2 21 28 25 13 19 200 200 250 0 Bally demand 200 200 250 Units transported 22 6 0 o a Plant 2 Total Transportation Costs $0 16 17 18 In what cells are the decision variables displayed? En que celdas se muestran las variables de decisión? Click Save and Submit to save and submit. Click Save All Answers to save all answers.
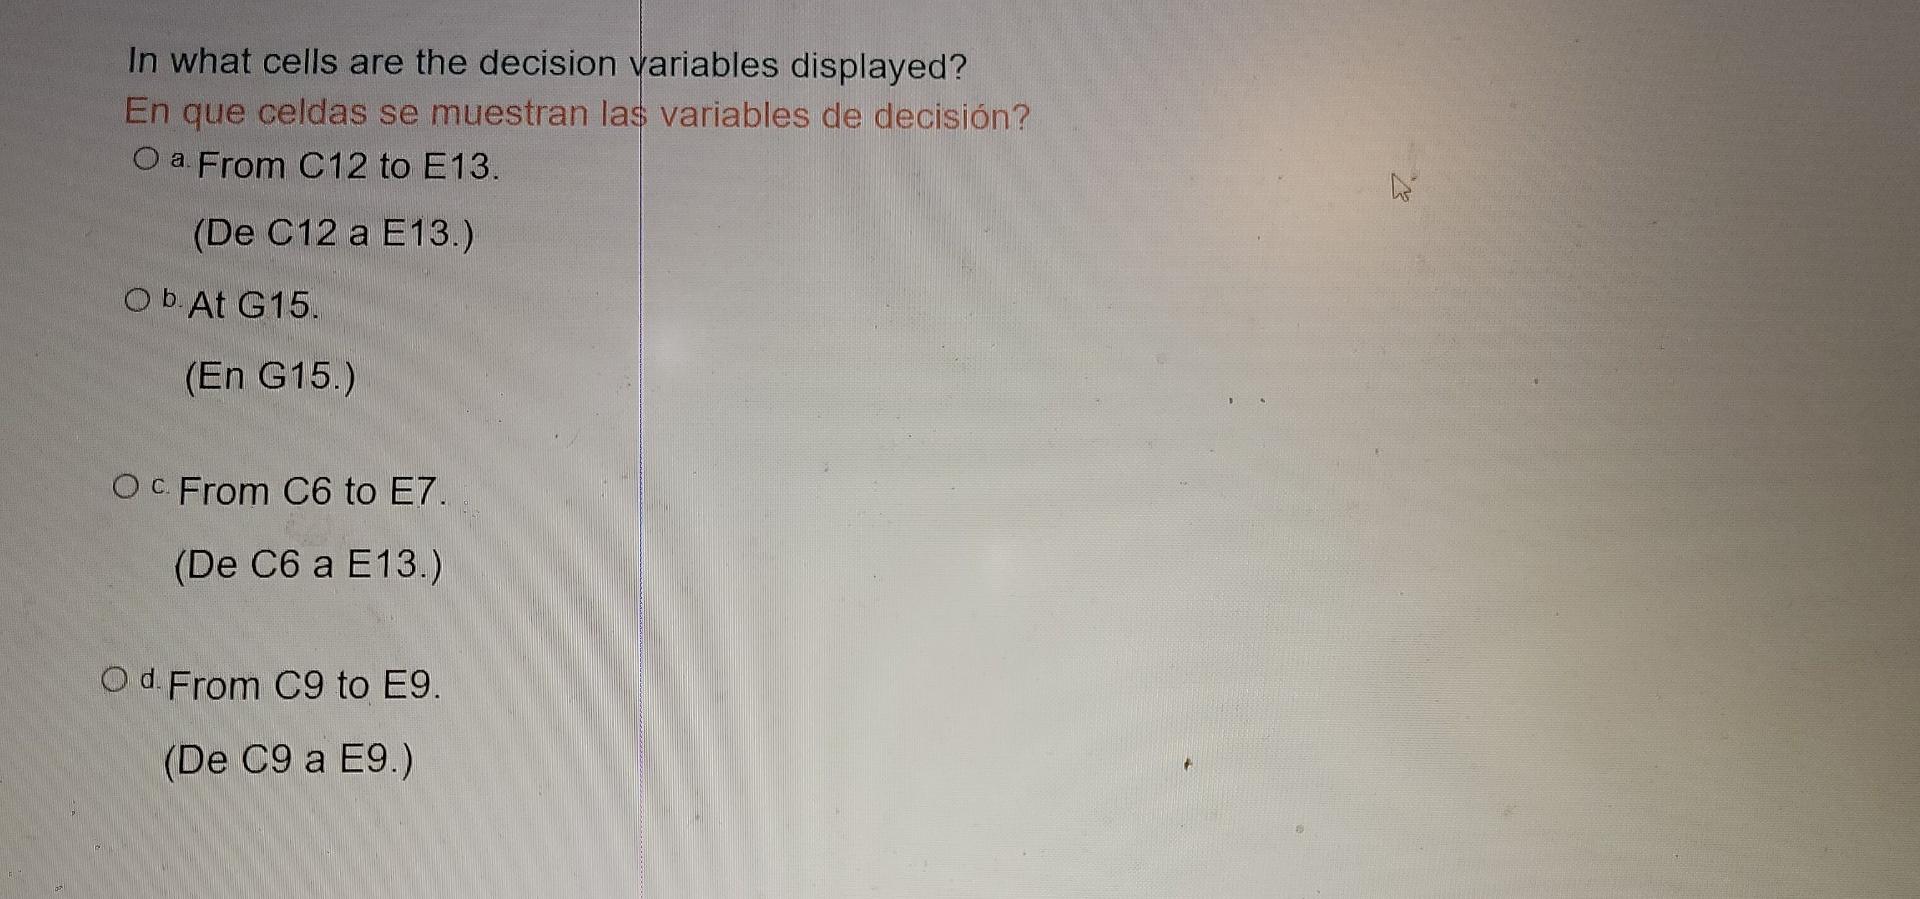
In what cells are the decision variables displayed? En que celdas se muestran las variables de decisión? O a. From C12 to E13. (De C12 a E13.) O b. At G15. (En G15.) O c. From C6 to E7. (De C6 a E13.) O d. From C9 to E9. (De C9 a E9.)

Estudia mejor, ¡ahora en español!
Entiende todos los problemas con explicaciones al instante y pasos fáciles de aprender de la mano de expertos reales.