¡Tu solución está lista!
Nuestra ayuda de expertos desglosó tu problema en una solución confiable y fácil de entender.
Mira la respuestaMira la respuesta done loadingPregunta: Create a file similar to "Project File.txt" containing at least 10 columns and 30 rows. Then create a Matlab script that does the following: 1) Allow to read the created ".txt" file. 2) Make a line graph where the "x" axis for all graphs is column 1 , while the " y " axis is each of the other columns (2-10). All the graphs must be in the same figure. 3)

this is a project of a computing for engineers course n the end result is supposed to look like the third picture(this is an example) , the first two pictures are the same! one in English n the other in Spanish
thank you in advanced! Queda solo un paso para resolver este problema.Solución

Texto de la transcripción de la imagen:
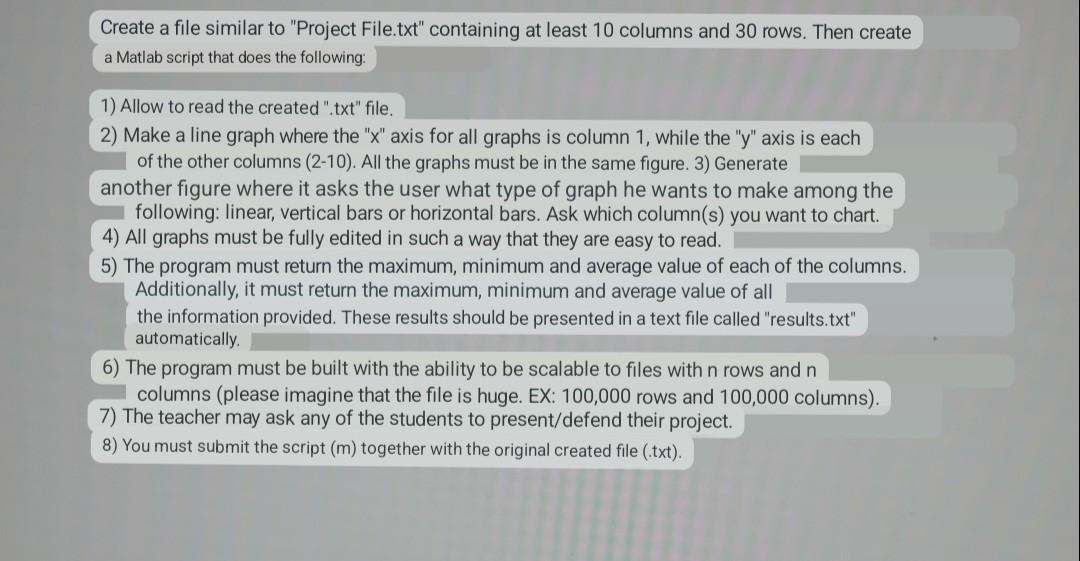
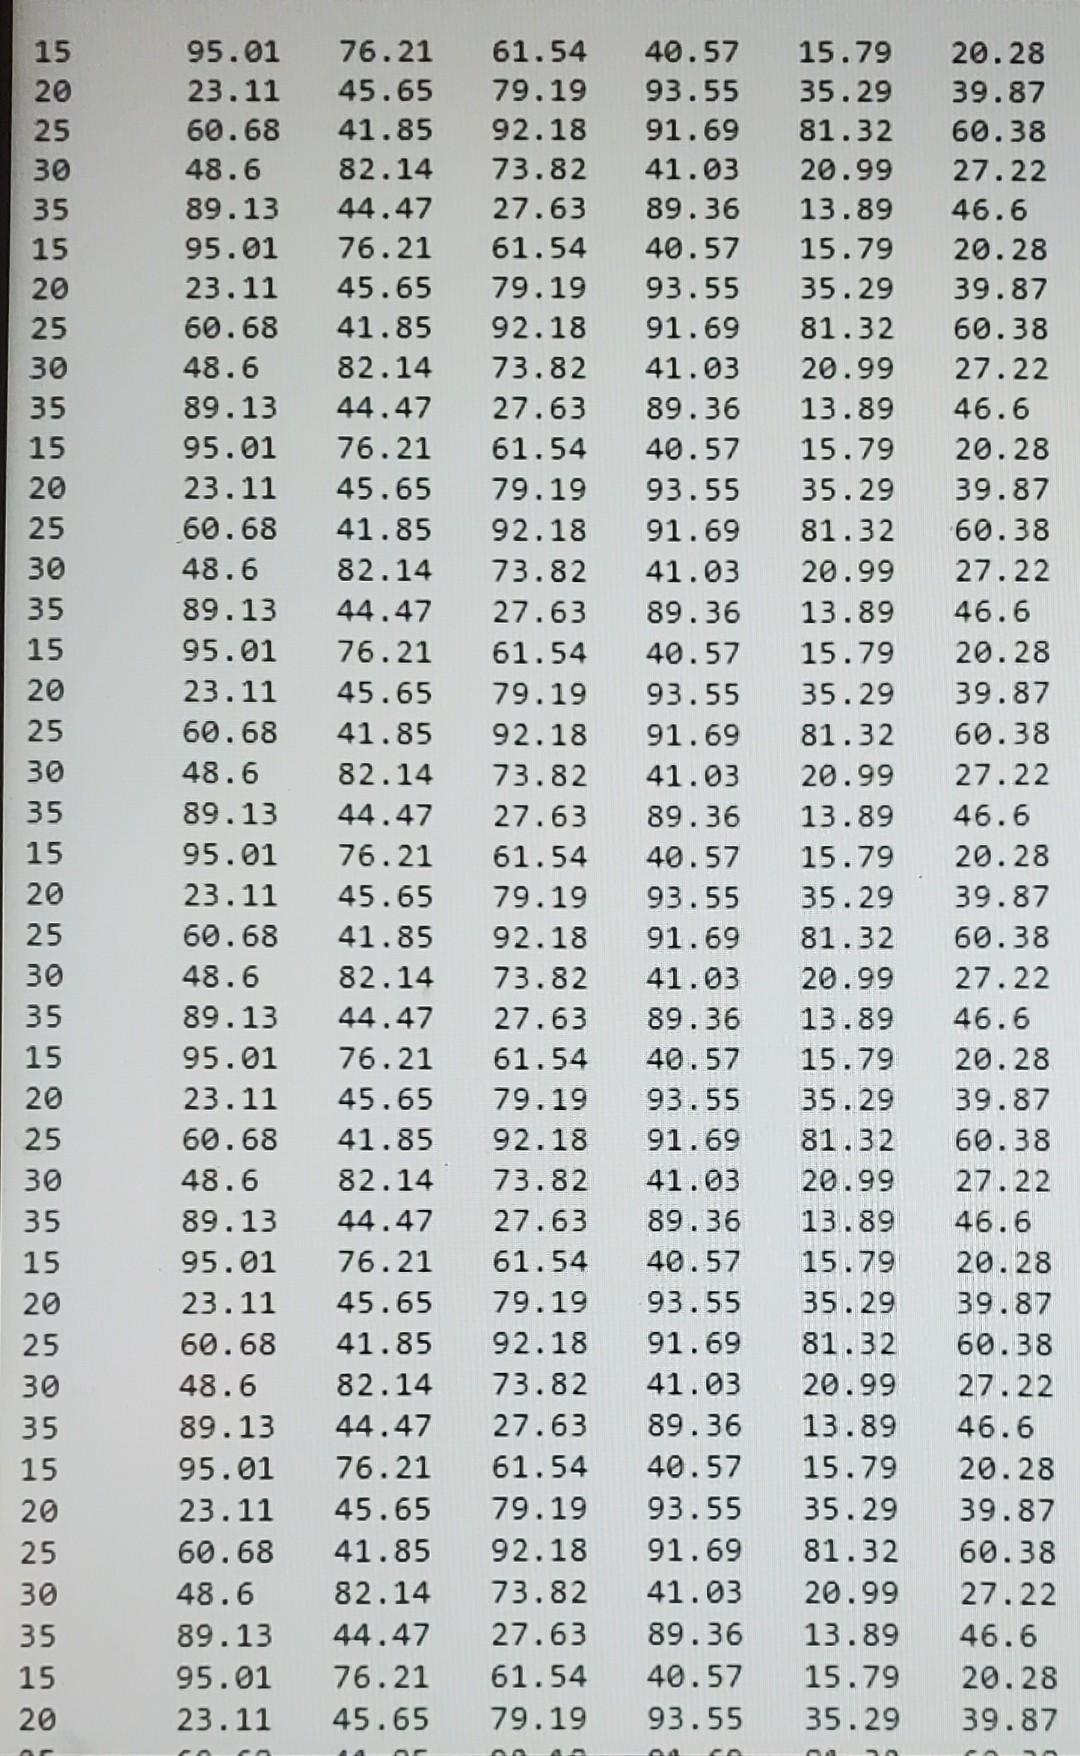
Create a file similar to "Project File.txt" containing at least 10 columns and 30 rows. Then create a Matlab script that does the following: 1) Allow to read the created ".txt" file. 2) Make a line graph where the "x" axis for all graphs is column 1 , while the " y " axis is each of the other columns (2-10). All the graphs must be in the same figure. 3) Generate another figure where it asks the user what type of graph he wants to make among the following: linear, vertical bars or horizontal bars. Ask which column(s) you want to chart. 4) All graphs must be fully edited in such a way that they are easy to read. 5) The program must return the maximum, minimum and average value of each of the columns. Additionally, it must return the maximum, minimum and average value of all the information provided. These results should be presented in a text file called "results.txt" automatically. 6) The program must be built with the ability to be scalable to files with n rows and n columns (please imagine that the file is huge. EX: 100,000 rows and 100,000 columns). 7) The teacher may ask any of the students to present/defend their project. 8) You must submit the script (m) together with the original created file (.txt).
1) Permita leer el archivo ".txt" creado. 2) Realice una gráfica lineal en donde el eje " x " para todas las gráficas es la columna 1, mientras que el eje " r " es cada una de las otras columnas (2-10). Todas las gráficas deben estar en la misma figura. 3) Genere otra figura en donde pregunte al usuario qué tipo de gráfica desea realizar entre las siguientes: lineal, barras verticales o barras horizontales. Solicite cuál(es) columna(s) desea graficar. 4) Todas las gráficas deben estar completamente editadas de tal forma que facilite su lectura. 5) El programa debe retornar el valor máximo, mínimo y promedio de cada una de las columnas. Adicionalmente debe retornar el valor máximo, mínimo y promedio de toda la información entregada. Dichos resultados deben ser presentados en un archivo de texto llamado "results.txt" de forma automática. 6) El programa debe ser construido con la capacidad de ser escalable a archivos con n filas y n columnas (favor imaginarse que el archivo sea gigante. Ej: 100,000 filas y 100,000 columnas). 7) El profesor podrá solicitar a alguno de los estudiantes que presenten/defiendan su proyecto. 8) Deberá someter el script (.m) junto al archivo original creado (.txt).

Estudia mejor, ¡ahora en español!
Entiende todos los problemas con explicaciones al instante y pasos fáciles de aprender de la mano de expertos reales.