¡Tu solución está lista!
Nuestra ayuda de expertos desglosó tu problema en una solución confiable y fácil de entender.
Mira la respuestaMira la respuesta done loadingPregunta: Pick two categorical variables (state both of them) then you are going to choose one, whichever one. Next you are going to make a circular diagram and a Pareto diagram, make comments interpreting the two graphs separately. Of two quantitative variables (state both of them), you will choose one, whichever one you want, then you will make a Histogram and a
Pick two categorical variables (state both of them) then you are going to choose one, whichever one. Next you are going to make a circular diagram and a Pareto diagram, make comments interpreting the two graphs separately. Of two quantitative variables (state both of them), you will choose one, whichever one you want, then you will make a Histogram and a Stem and Leaf diagram, compare them and comment on the shape of their distribution. Upload the 4 graphics and their comments respectively. The graphs must have titles to identify their variables.
Here are the 2 categorical and the 2 quantitative values needed.
PURPOSE OF THE QUESTION IS TO MAKE A CIRCULAR DIAGRAM, PARETO DIAGRAM, HISTOGRAM DIAGRAM AND A STEM AND LEAF DIAGRAM WHICH DATA GIVEN AND COMPARE THEM. Hay 2 pasos para resolver este problema.Solución

Texto de la transcripción de la imagen:
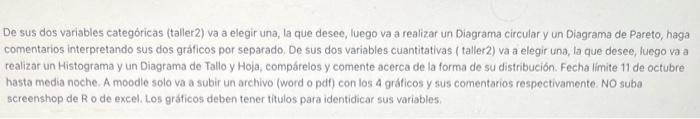
De sus dos variables categóricas (taller2) va a elegir una, la que desee, luego va a realizar un Diagrama circular y un Diagrama de Pareto, haga comentarios interpretando sus dos gráficos por separado. De sus dos variables cuantitativas ( taller2) va a elegir una, la que desee, luego va a realizar un Histograma y un Diagrama de Tallo y Hoja, compárelos y comente acerca de la forma de su distribución. Fecha limite 11 de octubre hasta media noche. A moodle solo va a subir un archivo (word o pdif) con los 4 gráficos y sus comentarios respectivamente. NO suba screenshop de R o de excel. Los gráficos deben tener titulos para identidicar sus variables.
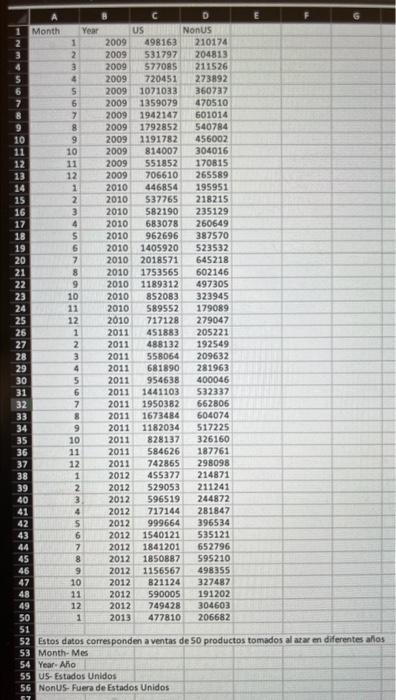
dos al arar en diferentes ahos Year- Aho US- Estados Unidos Nontus- Fuera de Estados Unidos

Estudia mejor, ¡ahora en español!
Entiende todos los problemas con explicaciones al instante y pasos fáciles de aprender de la mano de expertos reales.