Other Math Archive: Questions from June 09, 2022
-
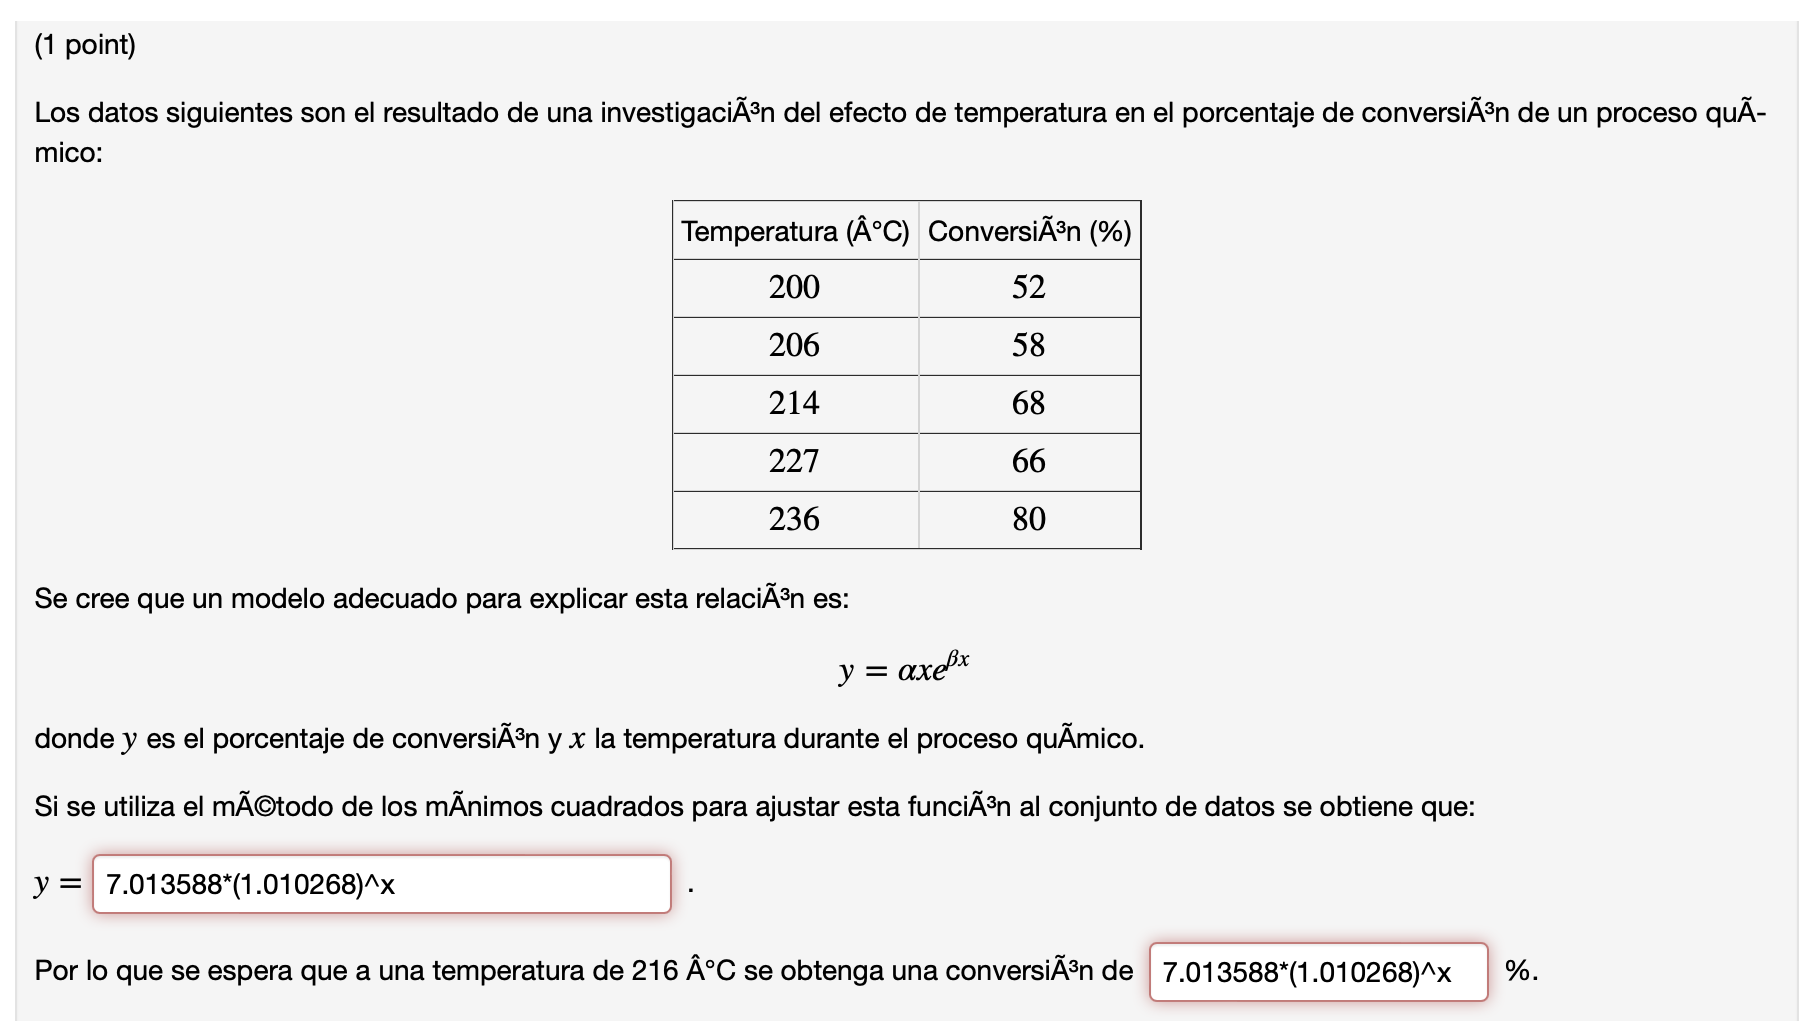
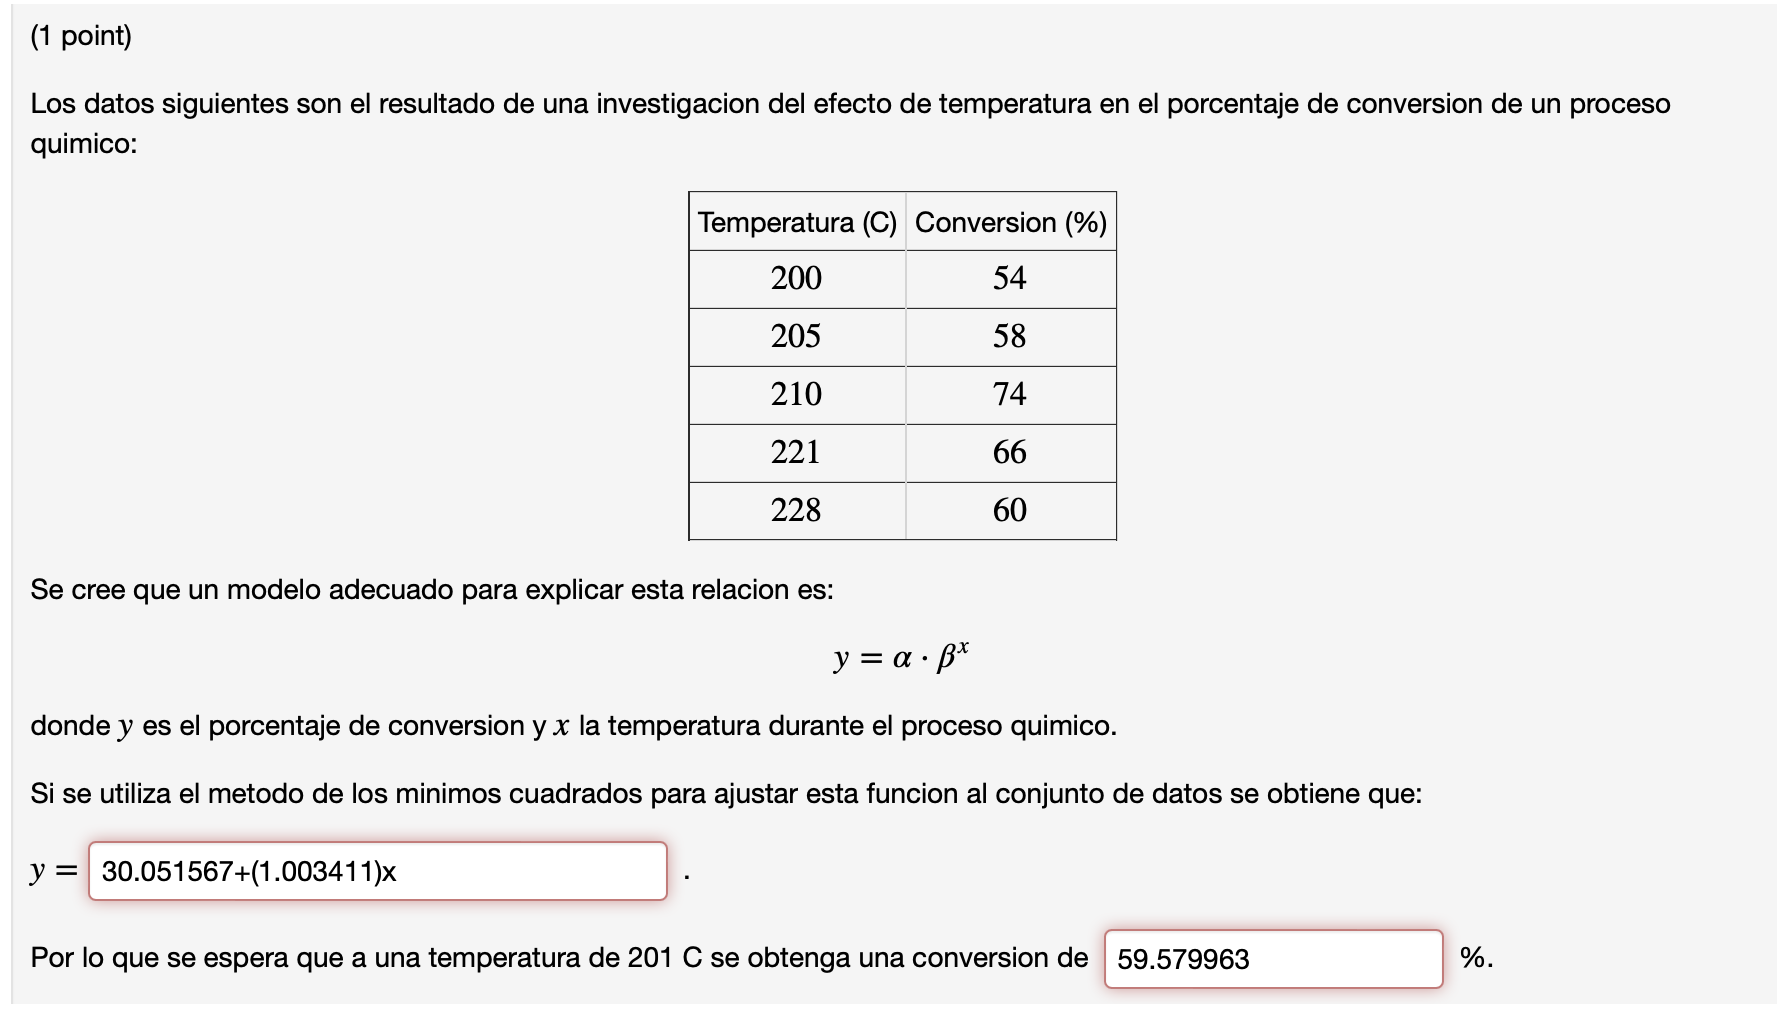
The following data is the result of an investigation of the effect of temperature on the conversion rate of a chemical process: Temperature (°C) Conversion (%) 200 54 205 66 216 74 224 66 220 90 A
Los datos siguientes son el resultado de una investigación del efecto de temperatura en el porcentaje de conversión de un proceso quÃmico: Temperatura (°C) Conversión (%) 200 54 205 66 211 answer -
1 answer
-
#25 only
In Exercises 17-30, either prove that the wff is a valid argument or give an interpretation in which it is false. 17. (3x)[4(x) AB(x)] → (3x)4(x)/(x)B(x) 18. (3x)[R(x) V S(x)] →x)R(x) V (3x)S(x) 11 answer -
3 answers
-
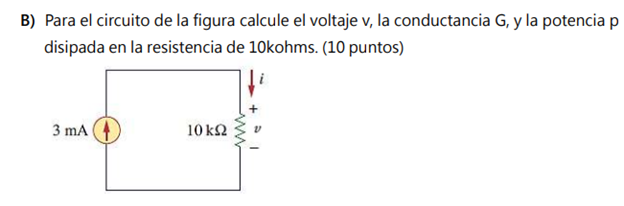
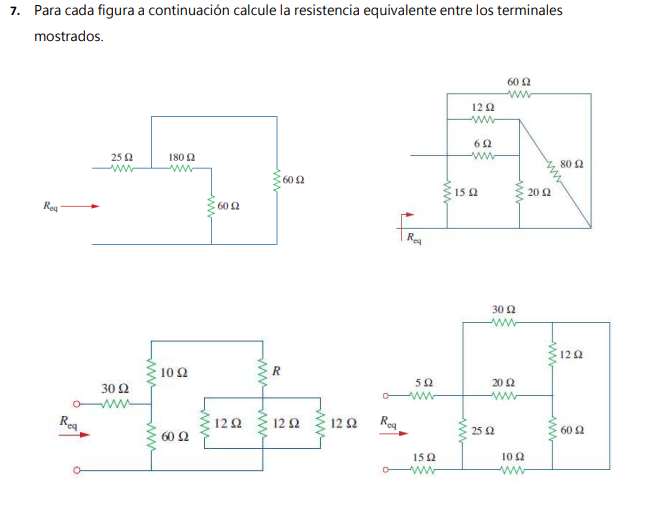
Solve in parallel.
A) Para el circuito de la figura calcule el valor de la resistencia equivalente entre ay b. Muestre sus pasos claramente (15 puntos). 30 Ω 12 Ω 5Ω 20 Ω ασ 60 Ω 15Ω Rab bow Μ Μ 25 Ω 10 Ω α1 answer -
3 answers
-
3 answers
-
1 answer
-
1 answer
-
25 and 27
25. y = √√x, y = x, 0≤x≤ 16 26. y = cos x, 27. y = cos x, y = 2 = cos x, 0≤x≤ 2π y = sin 2x, 0≤x≤ π/23 answers -
1 answer
-
2 answers
-
Using this, fit the following data to the model using least squares regression. Then the curve fitted to the data is and this is the translation
(1 point) La ecuación y = axe³x es equivalente a la ecuación In (): = Px + ln a. Usando esto, ajustar los siguientes datos al modelo usando regresión vÃa mÃnimos cuadrados. X y 3.2 2.31 5.1 answer -
1 answer
-
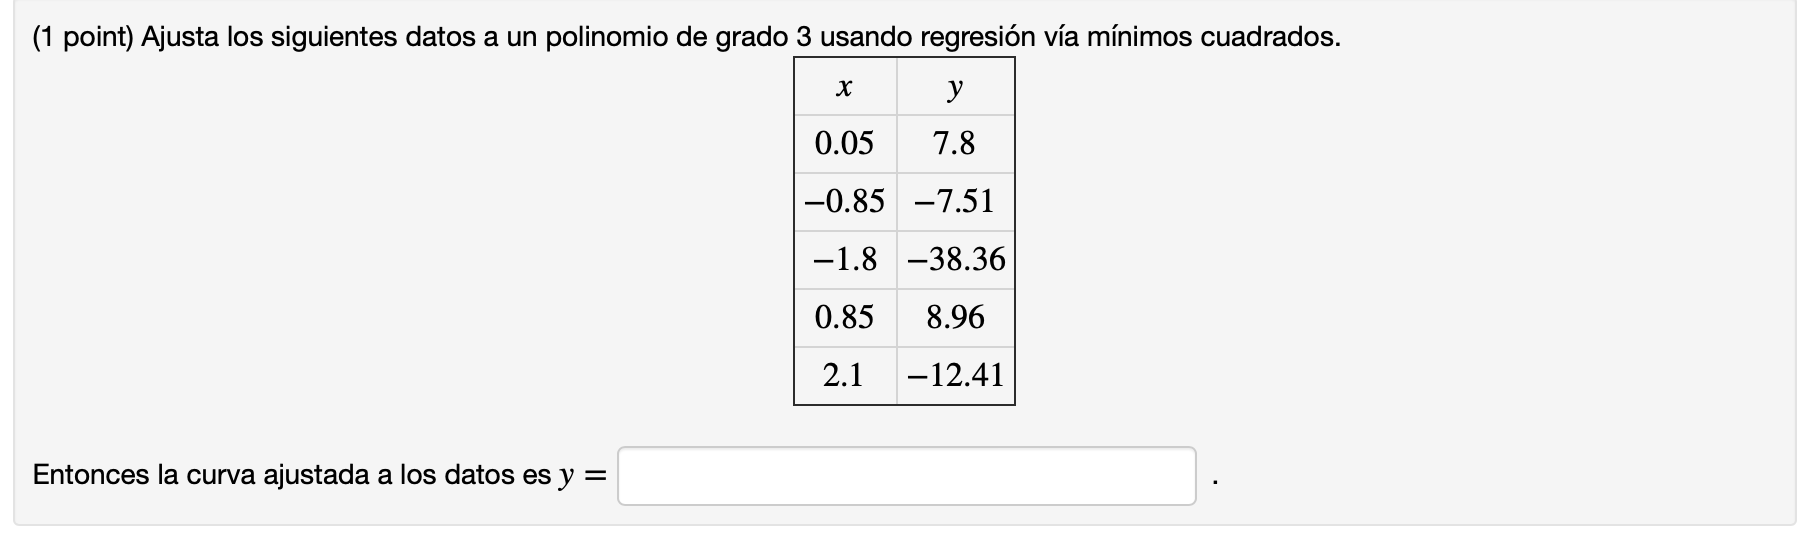
Fit the following data to a parabola using square regression. Then the curve fitted to the data is and
(1 point) Ajusta los siguientes datos a una parábola usando regresión vía cuadrados. X y -0.85 -0.86 -0.05 2.48 1.9 32.64 -2.1 4.03 1.05 16.6 Entonces la curva ajustada a los datos es y = 0.6638x -1 answer -
0 answers
-
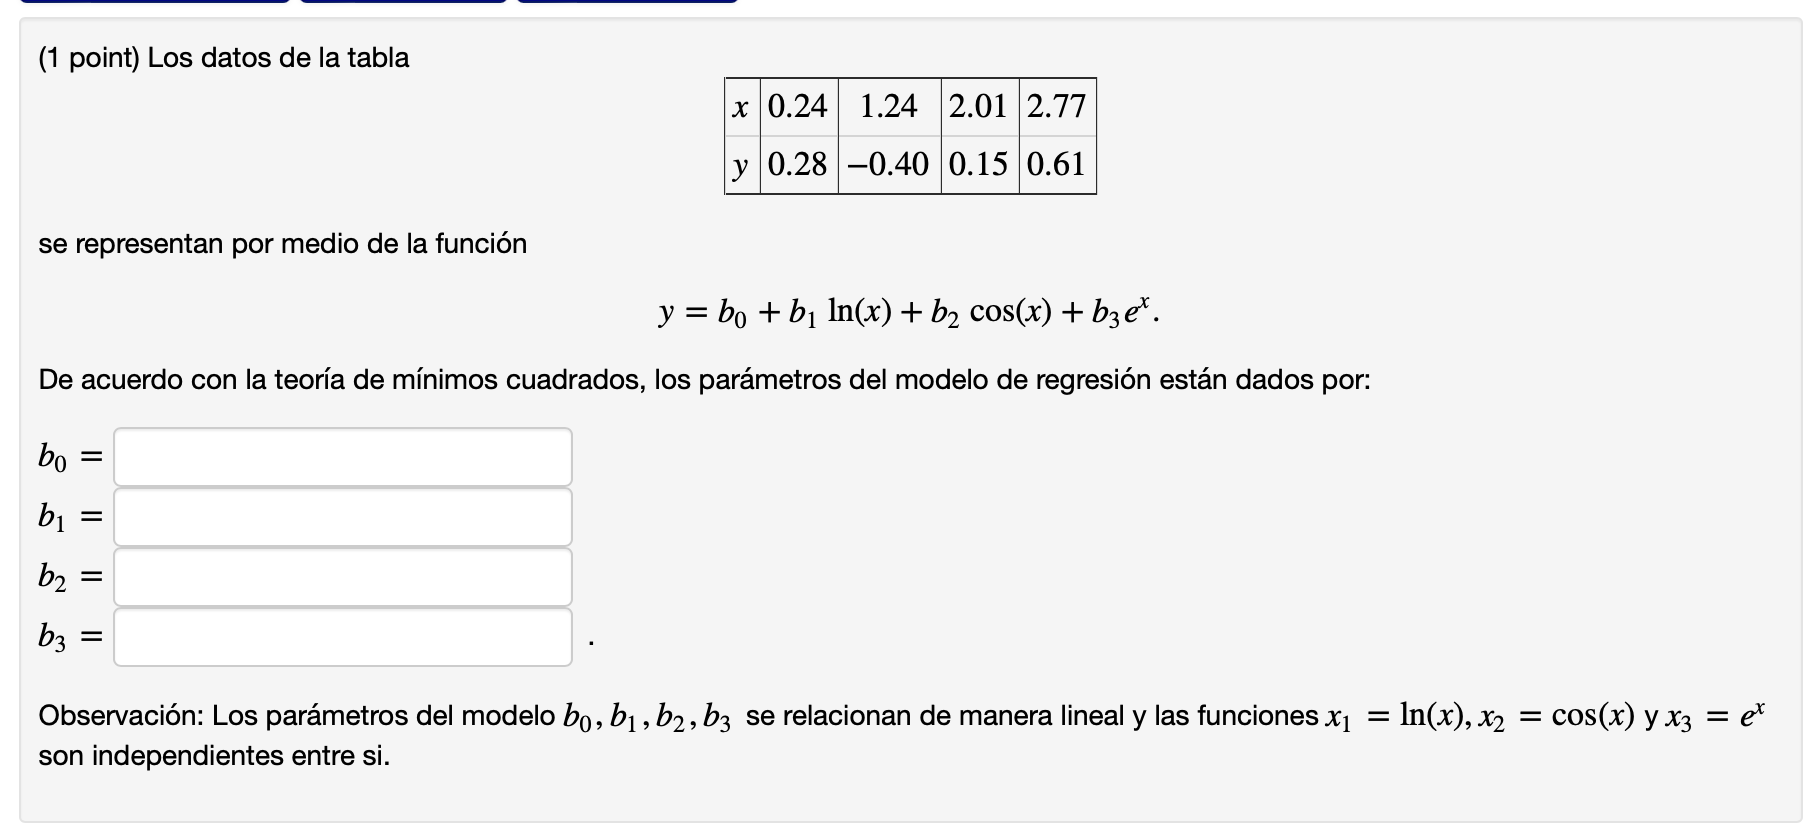
comes from a least squares fit problem. The minimum value of f(x,y,z) is obtained at x= y= z=
N 5(2, 1, 2) – Ë (2 k) – (² + f(x, y, = {} x + yn + zn²) 1². proviene de un problema de ajuste vía mínimos cuadrados. El valor mínimo de f(x, y, z) se obtiene en x = .y =1 answer