¡Tu solución está lista!
Nuestra ayuda de expertos desglosó tu problema en una solución confiable y fácil de entender.
Mira la respuestaMira la respuesta done loadingPregunta: Information:The data presented below were obtained in the second partial exam carried out by the students enrolled during the second semester of 2019 in group 05, in the General Statistics I course. Since there was a need to take the exam in two different classrooms , these data were grouped according to the classroom where the students took the test and
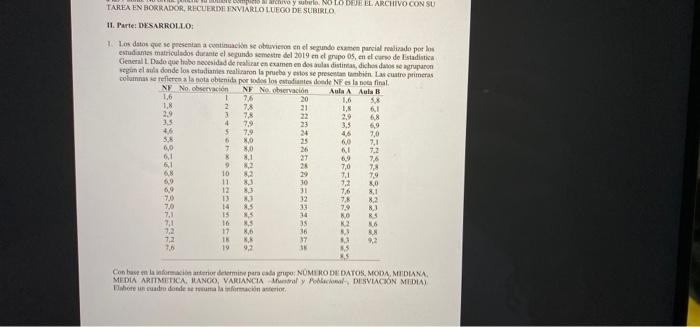
Information:The data presented below were obtained in the second partial exam carried out by the students enrolled during the second semester of 2019 in group 05, in the General Statistics I course. Since there was a need to take the exam in two different classrooms , these data were grouped according to the classroom where the students took the test and these are also presented. The first four columns refer to the grade obtained by all students where NF is the final grade.(Aula A is group A and Aula B is group B)So you're asked to:Based on the above information, determine for each group: NUMBER OF DATA,ARITHMETIC MEAN, RANGE, VARIANCE –Sample and Population–, MEAN DEVIATION). Create a table summarizing the above information. Esta es la mejor manera de resolver el problema.Solución
Group A: Excel calculation work (Assume data is stored in H2: H21 range ) : deviation = |(x-mean)| A deviation 1.6 4.79 1.8 4.59 2.9 3.49 …
Mira la respuesta completa
Texto de la transcripción de la imagen:
TAREA EN BORRADOR, RECUERDE ENVIARLO LUEGO DE SUBIRLO complets at schivo y subele. NO LO DEJE EL ARCHIVO CON SU 11. Parte: DESARROLLO: 1. Los datos que se presentan a continuación se obtuvieron en el segundo examen parcial realizado por los estudiantes matriculados durante el segundo semestre del 2019 en el grupo 05, en el curso de Estadistica General L Dado que hubo necesidad de realizar en examen en dos aulas distintas, dichos datos se agruparon según el aula donde los estudiantes realizaron la prueba y estos se presentan también. Las cuatro primeras columnas se refieren a la nota obtenida por todos los estudiantes donde NF es la nota final. NF No, observación NF No observación Aula A Aula B 1,6 1 76 20 1,6 5,8 1,8 2 7,8 21 1,8 6,1 2.9 3 7.8 22 29 6,8 3,5 479 23 3.5 6,9 4,6 5 19 46 7,0 5,8 6 8,0 6,0 7,1 6,0 7 8,0 61 7,2 6,1 8 8,1 6,9 76 6,1 9 8,2 7,0 7,8 6,8 10 8,2 71 18 6.9 11 8,3 72 8,0 6,9 83 16 8,1 13 83 7.8 8,2 14 8.5 7,9 8.3 7.1 15 8,5 KO R.S 16 8,5 K2 86 17 36 8,3 18 K.K 37 19 9,2 38 Con base en la información anterior determine para cada grupo: NÚMERO DE DATOS, MODA, MEDIANA MEDIA ARITMETICA, RANGO, VARIANCIA Elabore un cuadro donde se resuma la información anterior. Mastral y Poblacional-, DESVIACIÓN MEDIA) 70

Estudia mejor, ¡ahora en español!
Entiende todos los problemas con explicaciones al instante y pasos fáciles de aprender de la mano de expertos reales.