¡Tu solución está lista!
Nuestra ayuda de expertos desglosó tu problema en una solución confiable y fácil de entender.
Mira la respuestaMira la respuesta done loadingPregunta: The following table shows the population dynamic between bunnies (C) and foxes (Z) in years. The temporal evolution of these soecies can be modeled according to the following system of Lotka-Volterra equations. If we fit the model to the data we obtain:
The following table shows the population dynamic between bunnies (C) and foxes (Z) in years. The temporal evolution of these soecies can be modeled according to the following system of Lotka-Volterra equations. If we fit the model to the data we obtain:
Translation is in picture. Esta es la mejor manera de resolver el problema.Solución100% (1 calificación)

Texto de la transcripción de la imagen:
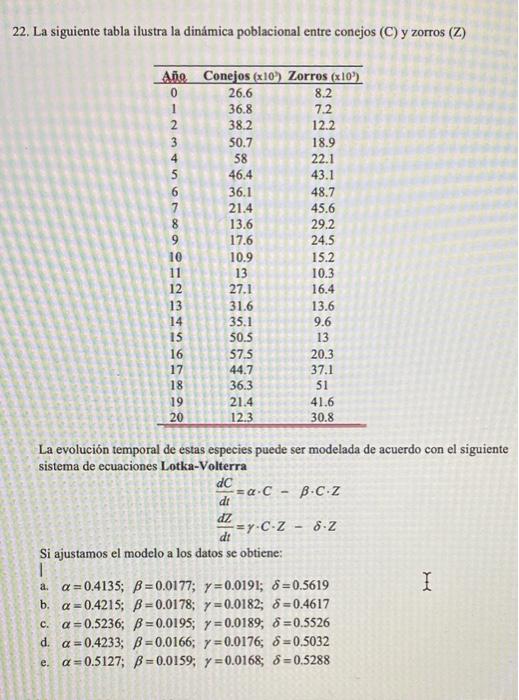
22. La siguiente tabla ilustra la dinámica poblacional entre conejos (C) y zorros (Z) Año Conejos (x10) Zorros (x10³) 0 26.6 8.2 1 36.8 7.2 38.2 12.2 50.7 18.9 58 22.1 46.4 43.1 36.1 48.7 21.4 45.6 13.6 29,2 17.6 24.5 10.9 15.2 13 10.3 27.1 16.4 31.6 13.6 35.1 9.6 50.5 13 57.5 20.3 44.7 37.1 36.3 51 21.4 41.6 20 12.3 30.8 La evolución temporal de estas especies puede ser modelada de acuerdo con el siguiente sistema de ecuaciones Lotka-Volterra dC ·=a. C - B-C.Z dt dz =y-C-Z 8-Z dt Si ajustamos el modelo a los datos se obtiene: 1 a. a=0.4135; B=0.0177; y=0.0191; 8=0.5619 I b. a=0.4215; B=0.0178; y=0.0182; -0.4617 B=0.0195; y=0.0189; &=0.5526 c. a=0.5236; d. a=0.4233; B=0.0166; y=0.0176; S=0.5032 e. a=0.5127; B=0.0159; y=0.0168; &=0.5288 23456ra1234V 9 10 11 15 16 17 18 6789
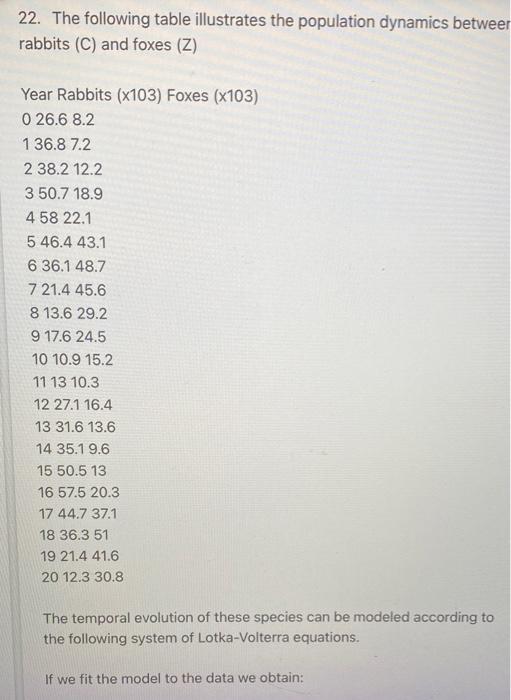
22. The following table illustrates the population dynamics betweer rabbits (C) and foxes (Z) Year Rabbits (x103) Foxes (x103) 0 26.6 8.2 1 36.8 7.2 2 38.2 12.2 3 50.7 18.9 4 58 22.1 5 46.4 43.1 6 36.1 48.7 7 21.4 45.6 8 13.6 29.2 9 17.6 24.5 10 10.9 15.2 11 13 10.3 12 27.1 16.4 13 31.6 13.6 14 35.1 9.6 15 50.5 13 16 57.5 20.3 17 44.7 37.1 18 36.3 51 19 21.4 41.6 20 12.3 30.8 The temporal evolution of these species can be modeled according to the following system of Lotka-Volterra equations. If we fit the model to the data we obtain:
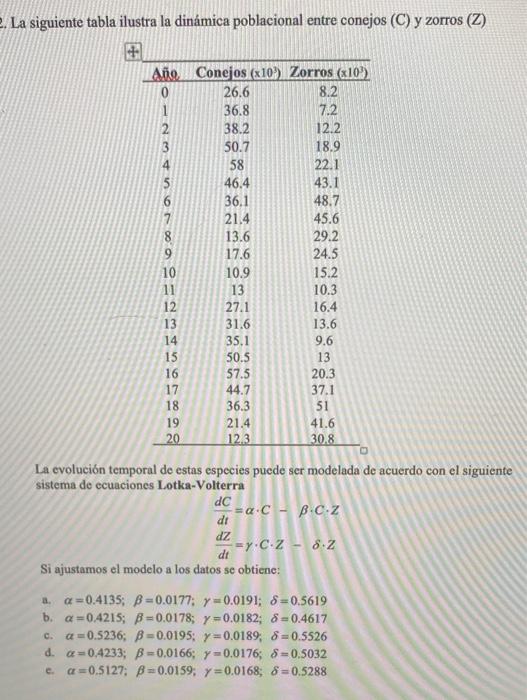
2. La siguiente tabla ilustra la dinámica poblacional entre conejos (C) y zorros (Z) Año Conejos (x103) Zorros (x10³) 26.6 8.2 36.8 7.2 38.2 12.2 50.7 18.9 58 22.1 46.4 43.1 36.1 48.7 21.4 45.6 13.6 29.2 9 17.6 24.5 10 10.9 15.2 11 13 10.3 12 27.1 16.4 13 31.6 13.6 14 35.1 9.6 15 50.5 13 16 57.5 20.3 17 44.7 37.1 18. 36.3 51 19 21.4 41.6 20 12.3 30.8 La evolución temporal de estas especies puede ser modelada de acuerdo con el siguiente sistema de ecuaciones Lotka-Volterra dC =a.C - B.C.Z dt dz -=y.C.Z - 8.2 dt Si ajustamos el modelo a los datos se obtiene: a. a=0.4135; p=0.0177; y=0.0191; 8=0.5619 b. a=0.4215; B=0.0178; y=0.0182; &=0.4617 c. a=0.5236; B=0.0195; y=0.0189, 8=0.5526 d. a=0.4233; B=0.0166; y=0.0176; 8=0.5032 e. a=0.5127; B=0.0159; y=0.0168; &=0.5288 12340

Estudia mejor, ¡ahora en español!
Entiende todos los problemas con explicaciones al instante y pasos fáciles de aprender de la mano de expertos reales.