Pregunta: For the following data: (Ordered) ∑X=1.035 ∑X2=60,42520 25 35 35 35 40 40 45 45 4550 55 55 60 65 65 70 75 85 90a) Make and Draw a Relative Frequency Diagram. Use 5 Classesb) Determine the average (mean) and variance (use computational formula)c) Draw the Box-Plot (Box-Wisker Diagram)d) Determine values of the outliers and, if there are any, what are
For the following data: OrderedXXa Make and Draw a Relative Frequency Diagram. Use Classesb Determine the average mean and variance use computational formulac Draw the BoxPlot BoxWisker Diagramd Determine values of the outliers and, if there are any, what are they?e Prepare a Stem and Leaf Diagramf Prepare a DotPlotI. Descriptiva: Realic el siguiente problema:Para los siguientes datos: Ordenadosa Realice y Dibuje un Diagrama de Frecuencia Relativa. Utilice Clasesb Determine el promediomedia y varianza use formula computacionalc Dibuje el BoxPlot BoxWisker Diagramd Determine valores de los nmeros atpicos outliers y si hay cuales sone Prepare un diagrama de Tallos y Hojas Stem and Leaf Diagramf Prepare un diagrama de puntos DotPlot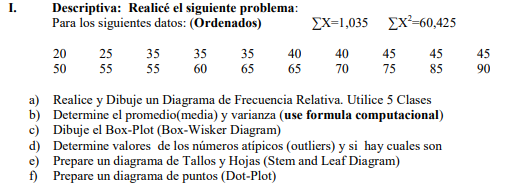
 Esta pregunta aún no se resolvió!¿No es lo que buscas?Envía tu pregunta a un experto en la materia.

Estudia mejor, ¡ahora en español!
Entiende todos los problemas con explicaciones al instante y pasos fáciles de aprender de la mano de expertos reales.