¡Tu solución está lista!
Nuestra ayuda de expertos desglosó tu problema en una solución confiable y fácil de entender.
Mira la respuestaMira la respuesta done loadingPregunta: Considering the following individual frequency distribution Match the rows in column 2 with the statistical measures in column 1. Standard deviation Q45 Amount of data Q1 Median Half Z-value (typified) for x =
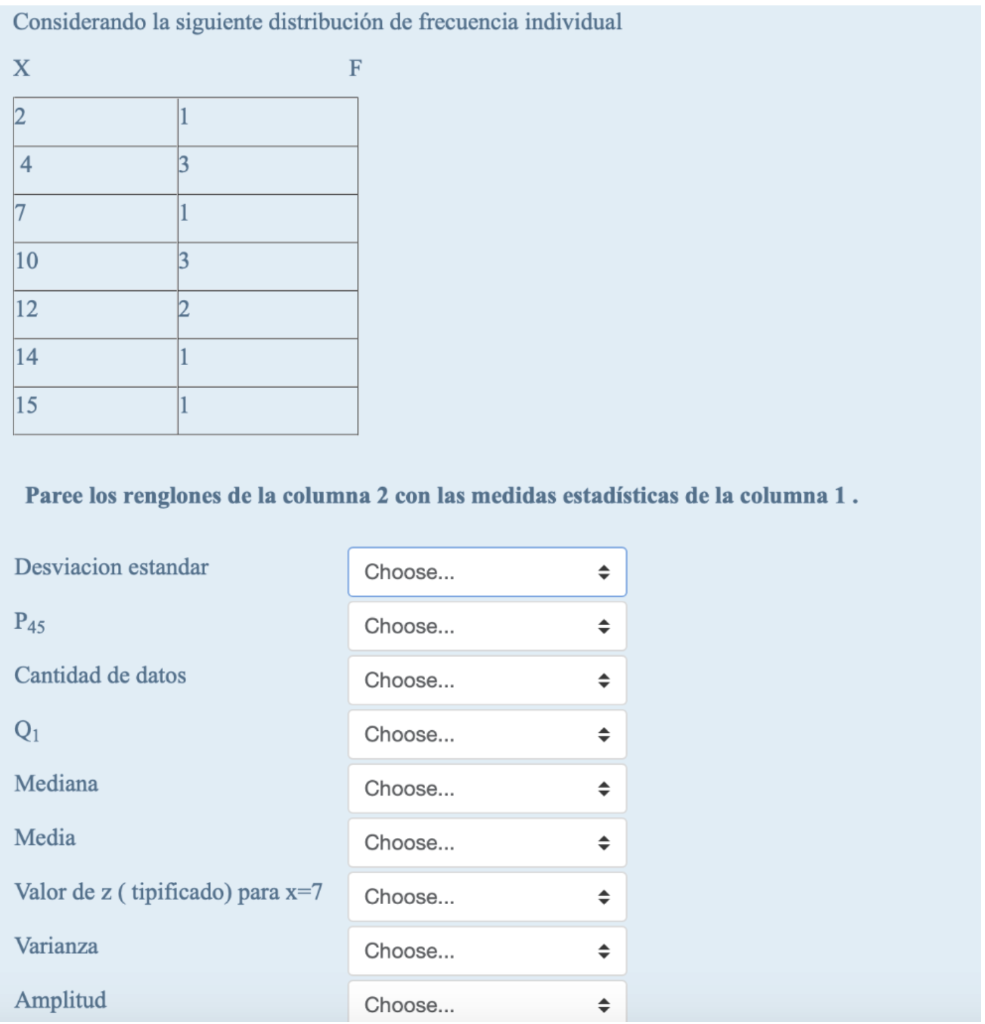
Considering the following individual frequency distribution
 Match the rows in column 2 with the statistical measures in column 1.
Standard deviation
Q45
Amount of data
Q1
Median
Half
Z-value (typified) for x = 7
Variance
Amplitude.
___________________________________________
posible answers:
4.36
10
12
17.38
9.85
19.56
5.5
13
8.67
-0.38
9.6
you can't determine
4.76
18.97
 Queda solo un paso para resolver este problema.SoluciónTe mostramos cómo abordar esta pregunta.
Este consejo generado con IA está basado en la solución completa de Chegg. ¡Regístrate para ver más!
To calculate the standard deviation, apply the formula using the sum of squares of the data and the square of the sum of the data divided by the number of observations.
Paso 1Mira la respuesta completaRespuesta Desbloquea
Texto de la transcripción de la imagen:
Considerando la siguiente distribución de frecuencia individual X Paree los renglones de la columna 2 con las medidas estadísticas de la columna 1 . Desviacion estandar P45 Cantidad de datos Q1 Mediana Media Valor de z ( tipificado) para x=7 Varianza Amplitud

Estudia mejor, ¡ahora en español!
Entiende todos los problemas con explicaciones al instante y pasos fáciles de aprender de la mano de expertos reales.