¡Tu solución está lista!
Nuestra ayuda de expertos desglosó tu problema en una solución confiable y fácil de entender.
Mira la respuestaMira la respuesta done loadingPregunta: Consider the data in Table 2a. Use least squares linear regression to fit a straight line. Get the slope a1 and the position coefficient (y-intercept) a0.b. Find the standard error Sy/x and the correlation coefficient r.c. Make a graph with
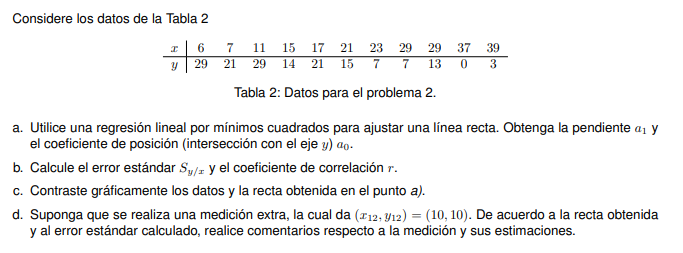
Consider the data in Table 2
a. Use least squares linear regression to fit a straight line. Get the slope a1 and the position coefficient (y-intercept) a0.
b. Find the standard error Sy/x and the correlation coefficient r.
c. Make a graph with the values given in table 2, to visualize how the straight line obtained is.
d. Suppose an extra measurement is made, which gives (x12, y12) = (10, 10). According to the line obtained and to the calculated standard error, comment on the measurement and its estimates.
 Hay 2 pasos para resolver este problema.SoluciónPaso 1Mira la respuesta completa
Para calcular la regresión lineal por mínimos cuadrados, el error estándar y el coeficiente de corre...
Paso 2 DesbloqueaRespuestaDesbloquea

Estudia mejor, ¡ahora en español!
Entiende todos los problemas con explicaciones al instante y pasos fáciles de aprender de la mano de expertos reales.