¡Tu solución está lista!
Nuestra ayuda de expertos desglosó tu problema en una solución confiable y fácil de entender.
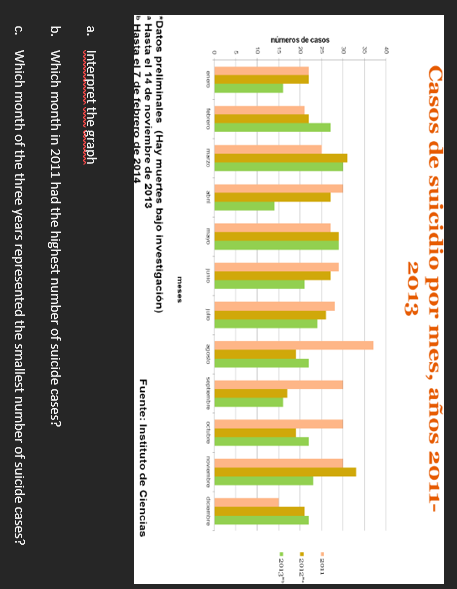
Mira la respuestaMira la respuesta done loadingPregunta: Casos de suicidio por mes, años 2011- 2013 Datos preliminales (Hay muertes bajo investigacion) Hasta el 14 de noviembre de 2013 Fuente: Instituto de Ciencias Hasta 17 de febrero de 2014 a. Interpret the graph b. Which month in 2011 had the highest number of suicide cases? c. Which month of the three years represented the smallest number of suicide cases?
 Esta es la mejor manera de resolver el problema.Solución
Answers : a. The given graph is a joint bar diagram. Y axis represents the no. Of suiside cases and x axis represents the months o…
Mira la respuesta completa
Texto de la transcripción de la imagen:
Casos de suicidio por mes, años 2011- 2013 Datos preliminales (Hay muertes bajo investigacion) Hasta el 14 de noviembre de 2013 Fuente: Instituto de Ciencias Hasta 17 de febrero de 2014 a. Interpret the graph b. Which month in 2011 had the highest number of suicide cases? c. Which month of the three years represented the smallest number of suicide cases?

Estudia mejor, ¡ahora en español!
Entiende todos los problemas con explicaciones al instante y pasos fáciles de aprender de la mano de expertos reales.