¡Tu solución está lista!
Nuestra ayuda de expertos desglosó tu problema en una solución confiable y fácil de entender.
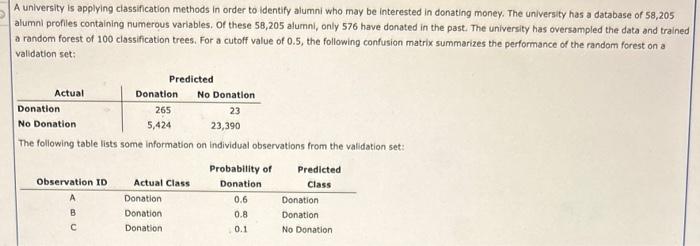
Mira la respuestaMira la respuesta done loadingPregunta: A university is applying classification methods in order to identify alumni who may be interested in donating money. The university has a database of 58,205 alumni profiles containing numerous varlables. of these 58,205 alumnl, only 576 have donated in the past. The university has oversampled the data and trained a random forest of 100 classification trees.
5: Necesito ayuda con todo esto. Hay 3 pasos para resolver este problema.SoluciónPaso 1Mira la respuesta completa
Dado,
La matriz resume el rendimiento del bosque aleatorio en un conjunto de validación:Actual\predicted
Donation
No donation
Donation
265
23
No donation
5424
23390
La siguiente...
Paso 2 DesbloqueaPaso 3DesbloqueaRespuestaDesbloquea
Texto de la transcripción de la imagen:
A university is applying classification methods in order to identify alumni who may be interested in donating money. The university has a database of 58,205 alumni profiles containing numerous varlables. of these 58,205 alumnl, only 576 have donated in the past. The university has oversampled the data and trained a random forest of 100 classification trees. For a cutoff value of 0.5 , the following confusion matrix summarizes the performance of the random forest on a validation set: The following table lists some information on individual observations from the validation set:
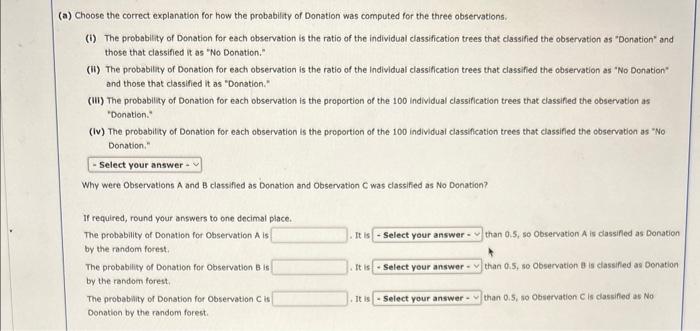
Choose the correct explanation for how the probability of Donation was computed for the three observations. (i) The probability of Donation for each observation is the ratio of the individual classification trees that classified the observation as "Donation" and those that classified it as "No Donation." (ii) The probability of Donation for each observation is the ratio of the Individual classification trees that classified the observation as "No Donation" and those that classified it as "Donation." (III) The probability of Donation for each observation is the proportion of the 100 individual classification trees that classified the observation as 'Donation." (iv) The probability of Donation for each observation is the proportion of the 100 individual classification trees that classified the observation as "No Donation," Why were Observations A and B classified as Donation and Observation C was classified as No Donation? If required, round your answers to one decimal place. The probability of Donation for Observation A is □ . It is □ than 0.5 , so Observation A is classifled as Donation by the random forest. The probability of Donation for Observation B- is □ . It is □ than 0.5 , so Observation 8 is classified as Donation by the random forest. The probability of Donation for Observation C is □ . It is □ than 0.5 , so Observation C is classified as No Donation by the random forest.
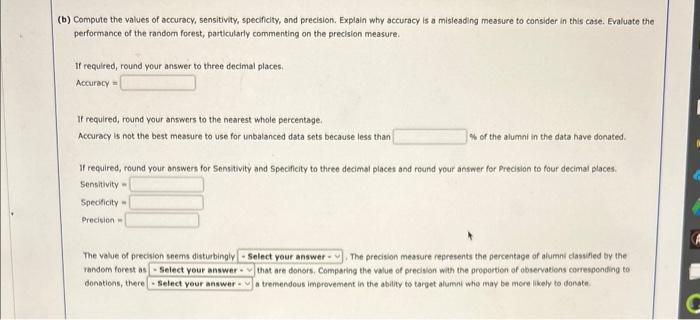
(b) Compute the values of accuracy, sensitivity, specificity, and precision. Explain why accuracy is a misleading measure to consider in this case. Evaluate the performance of the random forest, particularly commenting on the precision measure. If required, round your answer to three decimal places. Accuracy = □ If required, round your answers to the nearest whole percentage. Accuracy is not the best measure to use for unbalanced data sets because less than □ \% of the alumni in the data have donated. If required, round your answers for Sensitivity and Specificity to three decimal places and round your answer for Precislon to four decimal places. Sensitivity = □ Specificity = □ Precision = □ The value of precision seems disturbingly □ - The precision measure represents the percentage of alumni classified by the rendom forest as □ that are donors. Comparing the value of precision with the proportion of observations corresponding to donations, there a tremendous improvement in the ability to target alumni whe may be more likely to donste.

Estudia mejor, ¡ahora en español!
Entiende todos los problemas con explicaciones al instante y pasos fáciles de aprender de la mano de expertos reales.