¡Tu solución está lista!
Nuestra ayuda de expertos desglosó tu problema en una solución confiable y fácil de entender.
Mira la respuestaMira la respuesta done loadingPregunta: (13 polnts) 1. Chocolate contains the caffeine-like stimulant theobromine. A chemist working With a chocolate compary performed five theobromine analytical tests on a chocolate sample. The rasults of five determinations were found as follows: (A) If the mean of the results is 1.2% what is the standard deviation? (B) What is the relative stanchard deviation?
 Esta es la mejor manera de resolver el problema.Solución

Texto de la transcripción de la imagen:
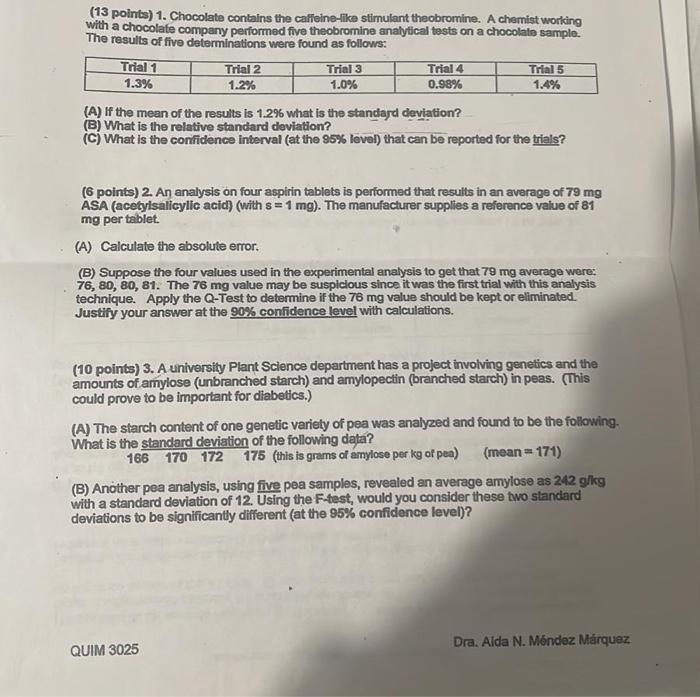
(13 polnts) 1. Chocolate contains the caffeine-like stimulant theobromine. A chemist working With a chocolate compary performed five theobromine analytical tests on a chocolate sample. The rasults of five determinations were found as follows: (A) If the mean of the results is 1.2% what is the standard deviation? (B) What is the relative stanchard deviation? (C) What is the conifidence interval (at the 95% level) that can be reported for the trials? (6 points) 2. An analysis on four aspirin tablets is periormed that results in an average of 79mg ASA (acetylsalicylic acid) (with s=1mg ). The manufacturer supplies a reference value of 81 mg per tablet. (A) Calculate the absolute error. (B) Suppose the four values used in the experimental analysis to get that 79mg average were: 76,80,80,81. The 76mg value may be susplcious since it was the first trial with this analysis technique. Apply the Q-Test to determine if the 76mg value should be kept or eliminated. Justify your answer at the 90% confidence level with calculations. (10 points) 3. A university Plant Science department has a project involving genetics and the amounts of amylose (unbranched starch) and amylopectin (branched starch) in peas. (This could prove to be important for diabetics.) (A) The starch content of one genetic variely of pea was analyzed and found to be the following. What is the standard deviation of the following data? 166170172175 (this is grams of amylose per kg of pea) ( m ) (B) Another pea analysis, using five pea samples, revealed an average amylose as 242 g/kg with a standard deviation of 12 . Using the F-test, would you consider these two standard deviations to be significantly different (at the 95% confidence level)?
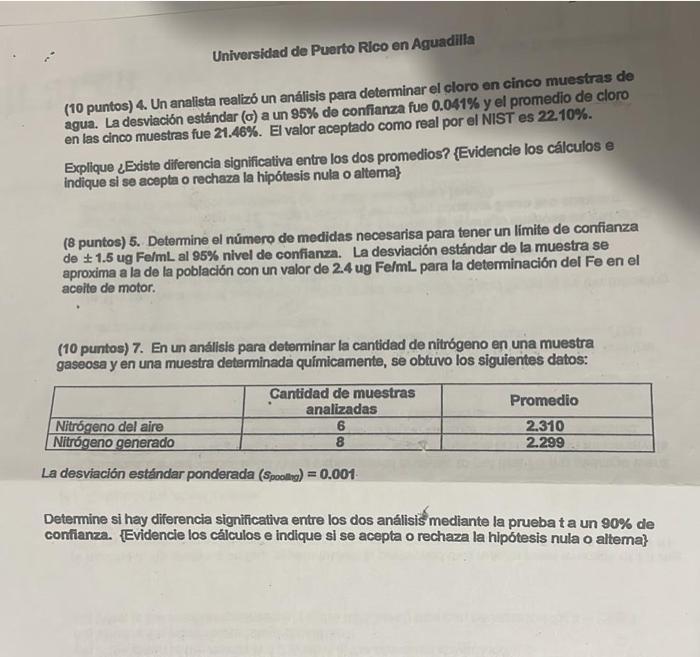
(10 puntos) 4. Un analista realizó un análisis para determinar el cloro on cinco muestras de agua. La desviación estaindar (σ) a un 95% de confianza fue 0.041% y el promedio de cloro en las cinco muestras fue 21.46\%. El valor aceptado como real por el NIST es 22.10%. Explique ¿Existe diferencia significativa entre los dos promedios? \{Evidencie los cálculos e indique si se acepta o rechaza la hipótesis nula o altema\} (8 puntos) 5. Determine el número de medidas necesarisa para tener un limite de confianza de ±1.5 ug FelmL al 95% nivel de confianza. La desviación estándar de la muestra se aproxima a la de la población con un valor de 2.4 ug Fe/mL para la determinación del Fe en el aceite de motor. (10 puntos) 7. En un análisis para determinar la cantidad de nitrógeno en una muestra gaseosa y en una muestra determinada quimicamente, se obtuvo los siguientes datos: La desviación estaindar ponderada ( Spoollag )=0.001 Determine si hay diferencia significativa entre los dos análisis mediante la prueba t a un 90% de confianza. \{Evidencie los cálculos e indique si se acepta o rechaza la hipótesis nula o altema\}

Estudia mejor, ¡ahora en español!
Entiende todos los problemas con explicaciones al instante y pasos fáciles de aprender de la mano de expertos reales.