¡Tu solución está lista!
Nuestra ayuda de expertos desglosó tu problema en una solución confiable y fácil de entender.
Mira la respuestaMira la respuesta done loadingPregunta: If we had 100 M&Ms distributed exactly according the manufacturer’s distribution, what is the expected mass and standard deviation?
If we had 100 M&Ms distributed exactly according the manufacturer’s distribution, what is the expected mass and standard deviation?
 Esta es la mejor manera de resolver el problema.Solución
SOLUTION :- GIVEN INFORMATION Mean Variance …
Mira la respuesta completa
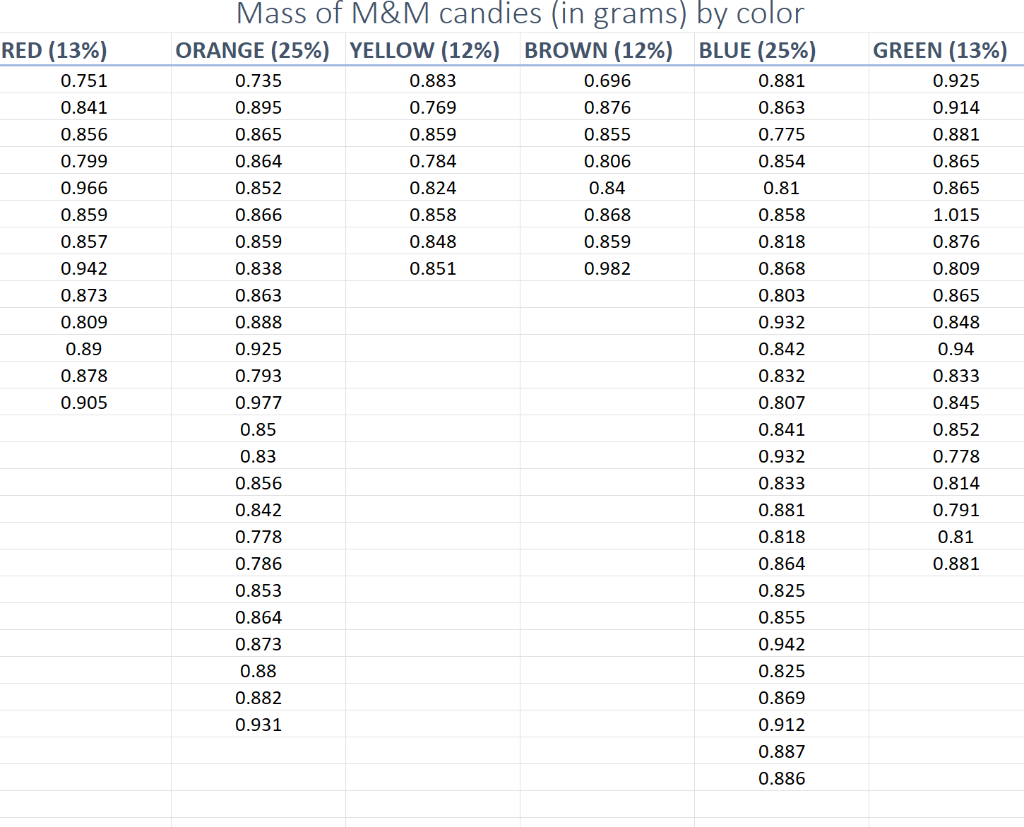
Texto de la transcripción de la imagen:
RED (13%) 0.751 0.841 0.856 0.799 0.966 0.859 0.857 0.942 0.873 0.809 0.89 0.878 0.905 Mass of M&M candies (in grams) by color ORANGE (25%) YELLOW (12%) BROWN (12%) BLUE (25%) 0.735 0.883 0.696 0.881 0.895 0.769 0.876 0.863 0.865 0.859 0.855 0.775 0.864 0.784 0.806 0.854 0.852 0.824 0.84 0.81 0.866 0.858 0.868 0.858 0.859 0.848 0.859 0.818 0.838 0.851 0.982 0.868 0.863 0.803 0.888 0.932 0.925 0.842 0.793 0.832 0.977 0.807 0.85 0.841 0.83 0.932 0.856 0.833 0.842 0.881 0.778 0.818 0.786 0.864 0.853 0.825 0.864 0.855 0.942 0.873 0.88 0.825 0.882 0.869 0.931 0.912 0.887 0.886 GREEN (13%) 0.925 0.914 0.881 0.865 0.865 1.015 0.876 0.809 0.865 0.848 0.94 0.833 0.845 0.852 0.778 0.814 0.791 0.81 0.881

Estudia mejor, ¡ahora en español!
Entiende todos los problemas con explicaciones al instante y pasos fáciles de aprender de la mano de expertos reales.