¡Tu solución está lista!
Nuestra ayuda de expertos desglosó tu problema en una solución confiable y fácil de entender.
Mira la respuestaMira la respuesta done loadingPregunta: 1) average2) Interquartile range3) variance(use_fomula.computaciona))4) Draw the Box-Plot (Box-WiNker Diagram) S) Prepare a Stem and Leaf Diagram6) Prepare a dot-R plot (Dot-Plot)
1) average2) Interquartile range3) variance(use_fomula.computaciona))4) Draw the Box-Plot (Box-WiNker Diagram) S) Prepare a Stem and Leaf Diagram6) Prepare a dot-R plot (Dot-Plot) Esta es la mejor manera de resolver el problema.Solución100% (1 calificación)
From the data set we are given and N = 30 1) Mean 2) Since the given set of data is in the ascending form, we have the first …
Mira la respuesta completa
Texto de la transcripción de la imagen:
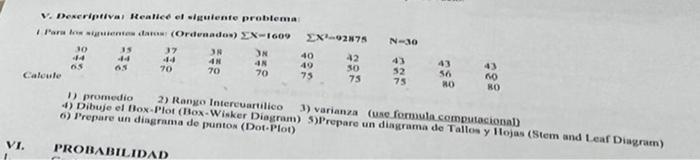
v. Descriptival Realicé el siguiente problema: Para los siguientes daros: (Ordenados) EX-1609 EX-92875 N-30 30 35 37 38 38 40 42 43 44 44 48 48 49 30 52 65 65 70 70 70 75 75 75 80 80 Calcule 1) promedio 2) Rango Intercuartilico 3) varianza (use formula computacional) 4) Dibuje el Box-Plot (Box-Wisker Diagram) 5)Prepare un diagrama de Tallos y Hojas (Stem and Leaf Diagram) 6) Prepare un diagrama de puntos (Dot-Plot) PROBABILIDAD VI. 44 43 56 43 60

Estudia mejor, ¡ahora en español!
Entiende todos los problemas con explicaciones al instante y pasos fáciles de aprender de la mano de expertos reales.