¡Tu solución está lista!
Nuestra ayuda de expertos desglosó tu problema en una solución confiable y fácil de entender.
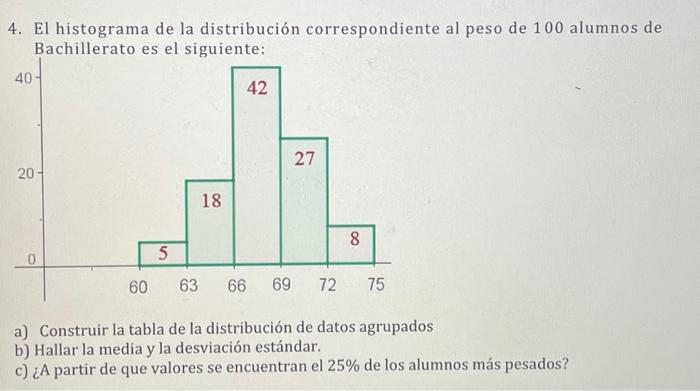
Mira la respuestaMira la respuesta done loadingPregunta: . The histogram of the distribution corresponding to the weight of 100 high school students is as follows:a) Build the distribution table of grouped datab) Find the mean and standard deviation.c) From what values are the 25% of the heaviest students found?
. The histogram of the distribution corresponding to the weight of 100 high school students is as follows:a) Build the distribution table of grouped datab) Find the mean and standard deviation.c) From what values are the 25% of the heaviest students found? Hay 3 pasos para resolver este problema.SoluciónPaso 1Mira la respuesta completa
Este es un ejercicio aplicado de estadística en el que se da un histograma y se pide hacer la tabla ...
Paso 2 DesbloqueaPaso 3DesbloqueaRespuestaDesbloquea
Texto de la transcripción de la imagen:
4. El histograma de la distribución correspondiente al peso de 100 alumnos de Bachillerato es el siguiente: a) Construir la tabla de la distribución de datos agrupados b) Hallar la media y la desviación estándar. c) ¿A partir de que valores se encuentran el 25% de los alumnos más pesados?

Estudia mejor, ¡ahora en español!
Entiende todos los problemas con explicaciones al instante y pasos fáciles de aprender de la mano de expertos reales.